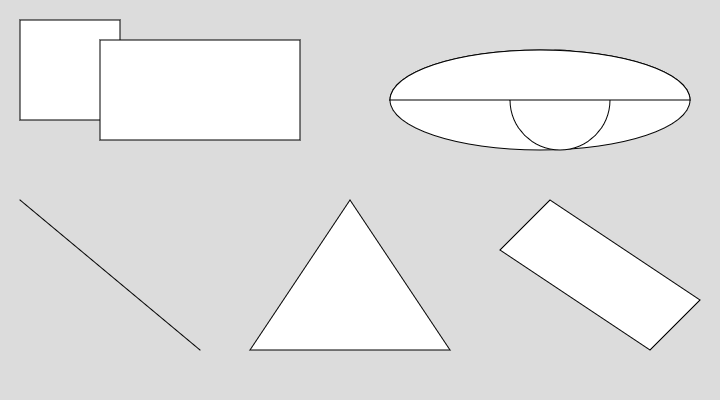
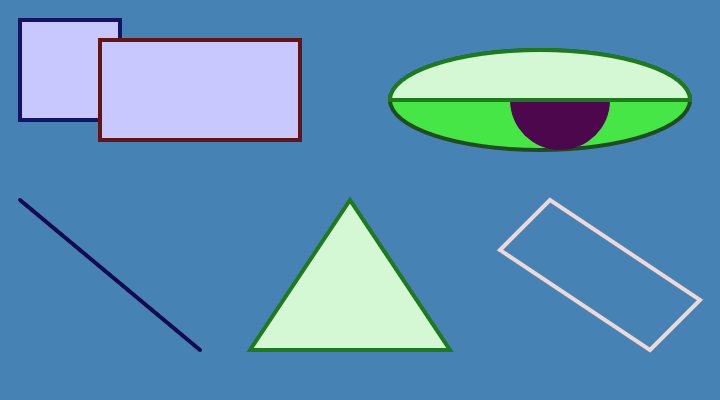
Welcome to p5.js! New to p5.js and want to learn some basics for creating an interactive sketch? Follow this tutorial to create a simple interactive landscape. You will learn how to:
- Change the canvas size and background color
- Add, customize, and color shapes and text
- Add simple interactivity by having your sketch respond to the mouse pointer position
- Comment code
- Use the p5.js reference pages to learn more
Prerequisites
Before you begin you should be able to:
- Log in to the p5.js Web Editor and save a new project
or
- Create and save a new p5.js project in VS Code (or another code editor)
For a step-by-step guide to creating and saving projects in the p5.js Web Editor or VS Code, visit Setting Up Your Environment.
Step 1: Name and save a new p5.js project
- Create a new p5.js project, give it a name, and save it.
Using the p5.js Web Editor:
- Log in to the p5.js Web Editor.
- Name your project “Interactive Landscape” by clicking the pencil icon and typing “Interactive Landscape” into the text box that appears.
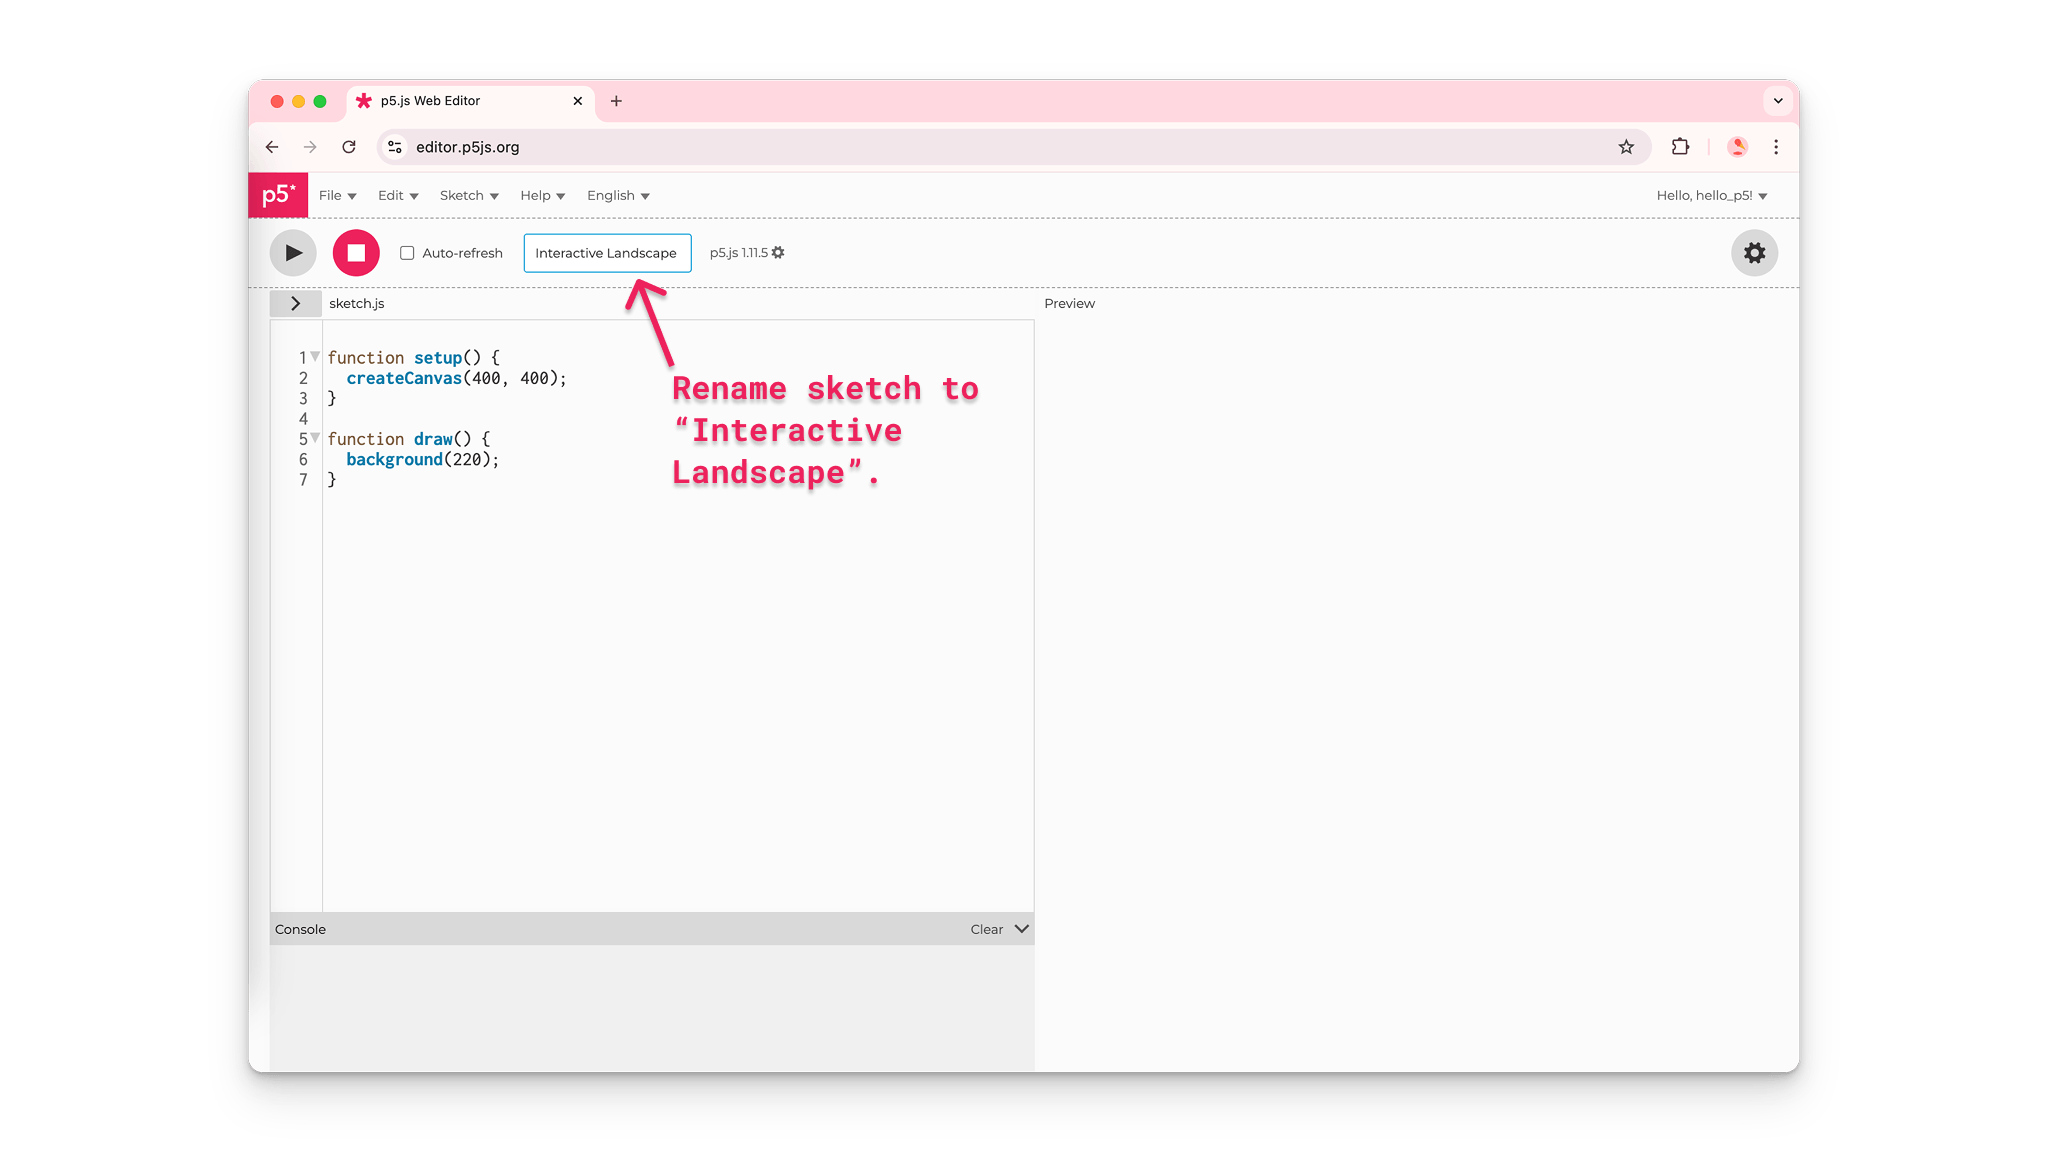
A user on the p5.js Web Editor names a new project “Interactive Landscape”.
- Click on File and select Save.
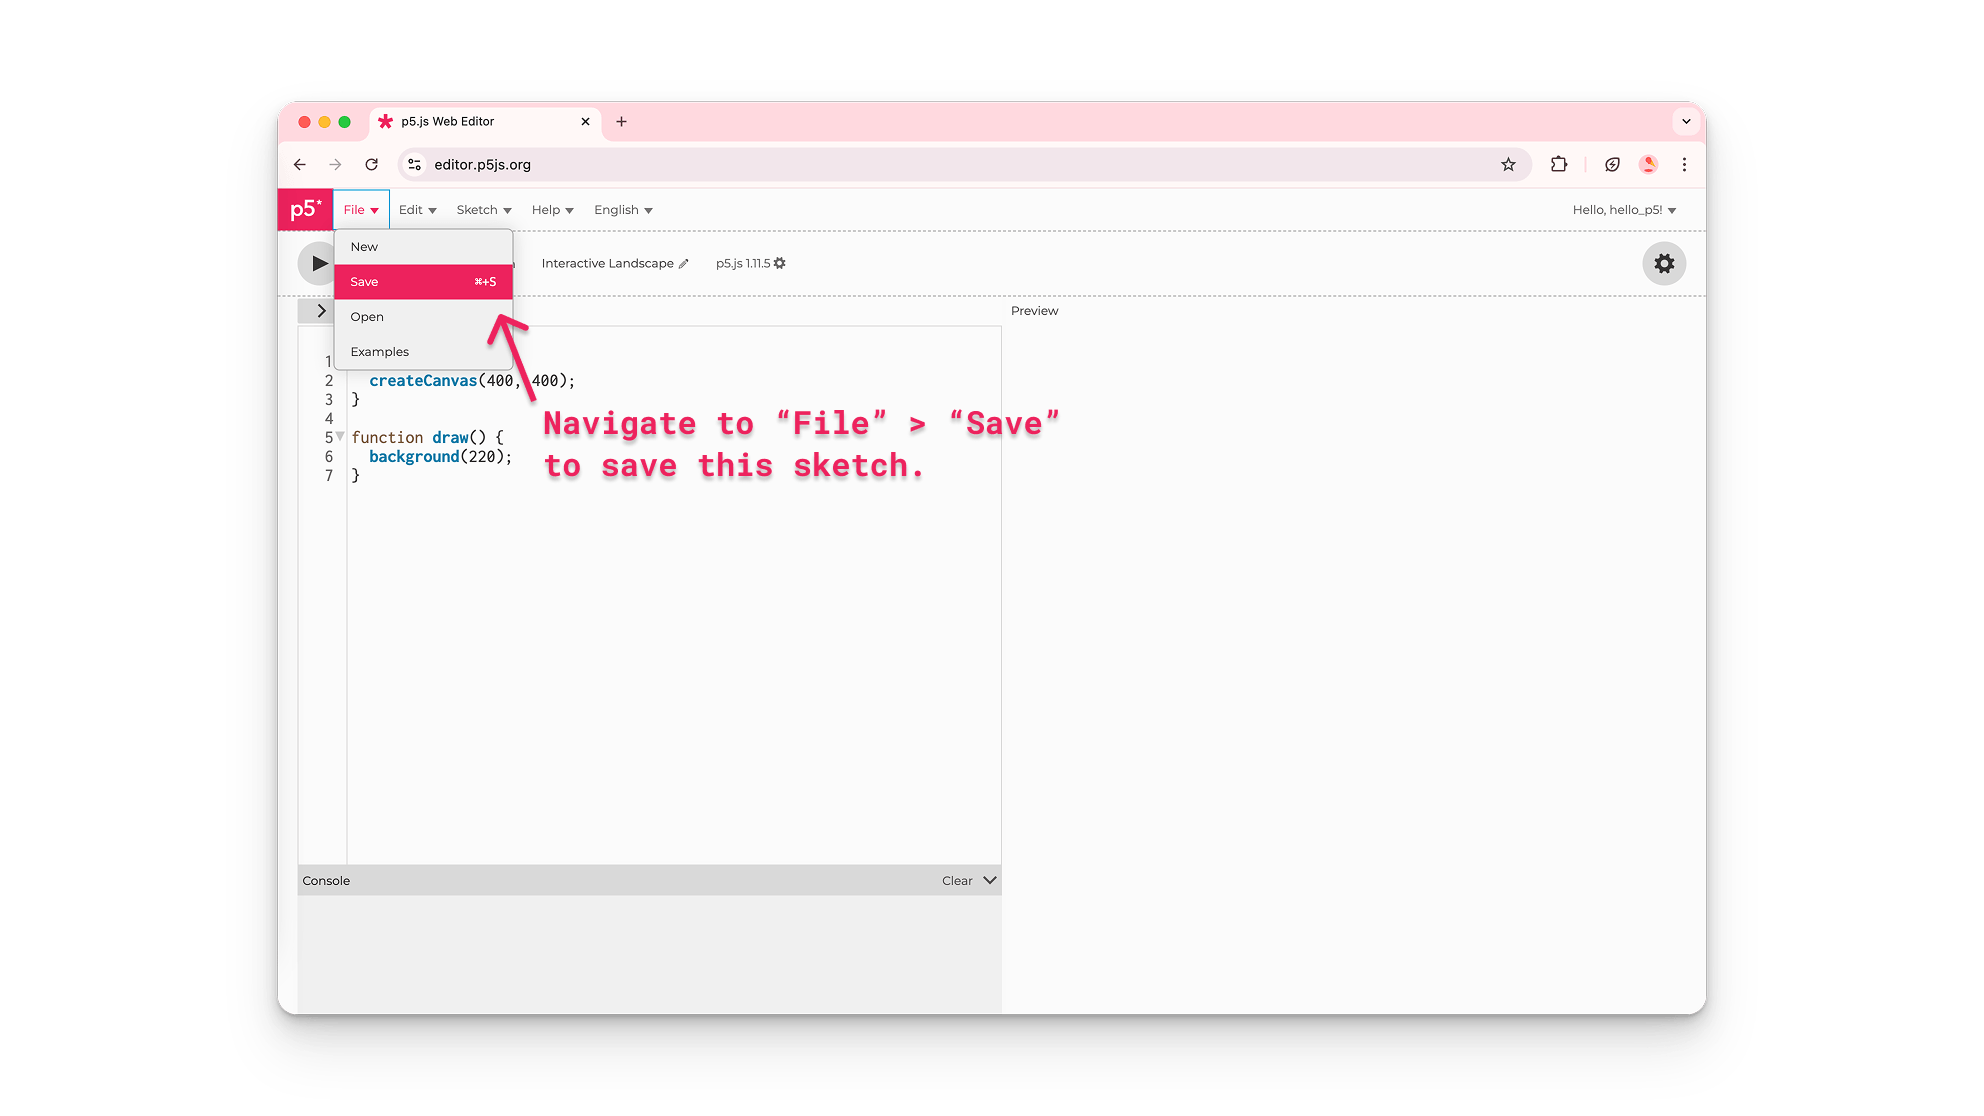
A user on the p5.js Web Editor saves their new project "Interactive Landscape".
- Confirm your project is saved by navigating to your gallery of saved sketches:
- Click on File and select Open.
- Your most recent sketches will appear at the top of the list of projects saved on your account.
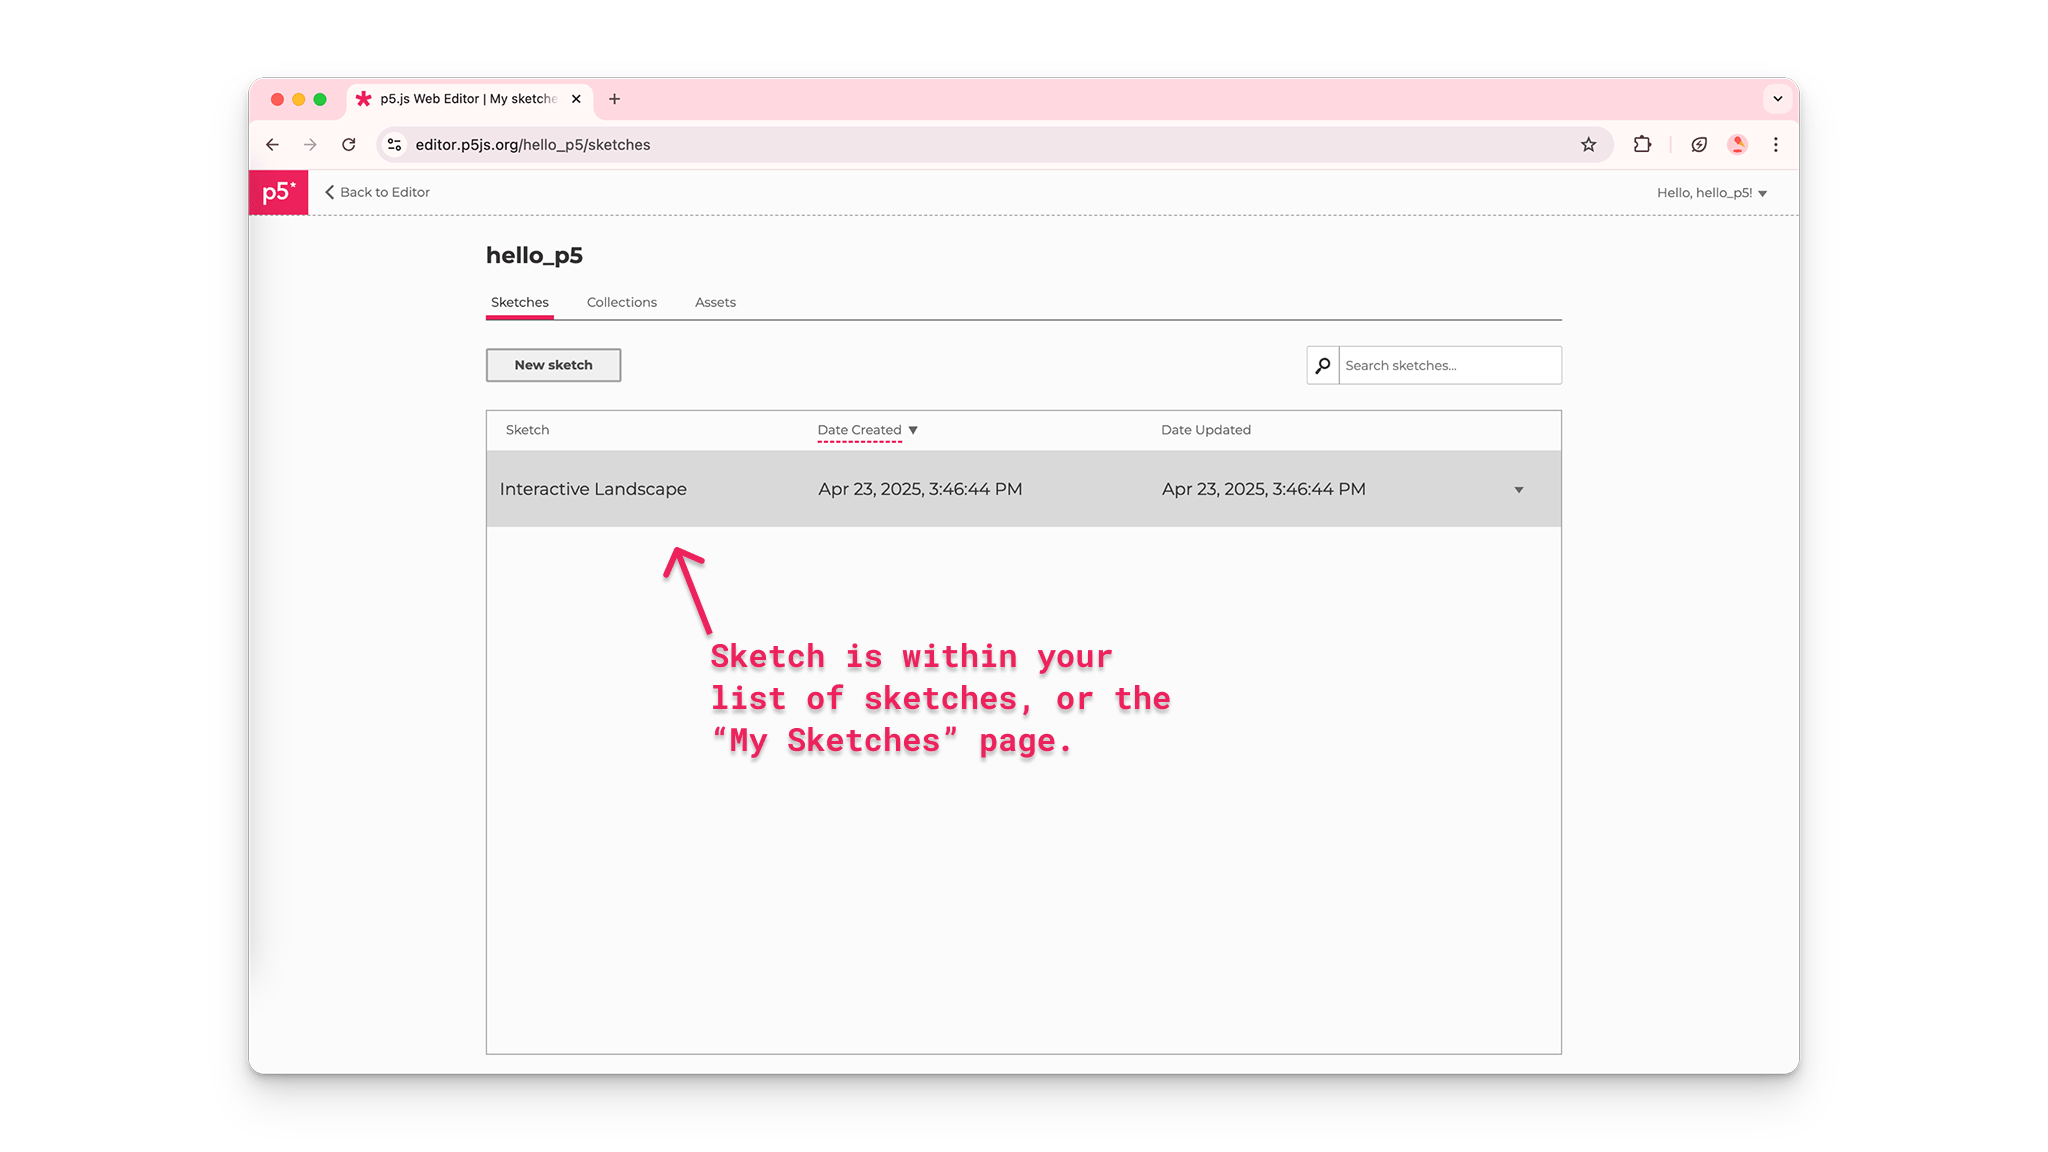
A user on the p5.js Web Editor finds their project "Interactive Landscape" in their gallery of saved sketches.
Default Code
All p5.js projects include the p5.js library and three files: index.html, style.css, and sketch.js. Make changes on the canvas by adding code to the sketch.js file. New p5.js projects begin with the following code in the sketch.js file:
    function setup() {
  createCanvas(400, 400);
}
function draw() {
  background(220);
}
Every sketch.js file begins with two main functions: setup() and draw().
Functions are sequences of instructions that perform specific tasks.
When the code in sketch.js is executed:
setup()is called and runs one time. It can be used to set default values for your project.- Within the curly brackets (
{}) forsetup(),createCanvas(400, 400)creates an HTML canvas that is 400 pixels wide and 400 pixels high that you can see in the preview window.
- Within the curly brackets (
draw()is called directly aftersetup()and executes the lines of code inside its curly brackets 60 times per second until the program is stopped or thenoLoop()function is called.- Within the curly brackets of
draw(), also known as thedraw()code block, thebackground()function sets the color of the canvas background. The default value (220) sets the color of the canvas to gray.
- Within the curly brackets of
Visit the p5.js reference pages for setup(), draw(), createCanvas(), and background() to learn more.
Step 2: Change the size of the canvas
- Change the size of the canvas so that it is 600 pixels wide and 400 pixels high by changing the arguments for
createCanvas(). Press Play to see changes in the preview window. - Make sure you press the Play button or have the Auto-refresh box checked to update the canvas.
Your code should look like this:
    function setup() {
  createCanvas(600, 400);
}
function draw() {
  background(220);
}
Click Play and check the box next to “Auto-refresh” on the p5.js Web Editor to continuously update the canvas as you add more code to your project. With this box checked, you won’t need to press the Play button every time you make changes to your sketch.
Step 3: Use comments to describe code
- Write a comment that describes what
createCanvas(600, 400)does.
Your code can look like this:
    function setup() {
  // Creates a canvas 600 pixels wide
  // and 400 pixels high.
  createCanvas(600, 400);
}
function draw() {
  background(220);
}
Comments
Using comments in your sketches can help you remember the purpose of each line of code. Since JavaScript can’t read comments, they are a great way to communicate your ideas to other people who explore your code, or to remind yourself of what your code is doing.
- Use two forward slashes anywhere in the sketch (
//comment) to embed single line comments.
Statements
sketch.js files are written in JavaScript, where each line of code is called a statement. Each statement ends with a semicolon (;). It is best practice to add semicolons after every statement you write in the sketch.js file. You SHOULD NOT include a semicolon after curly brackets in functions and if statements.
For more information about comments and statements, watch this video from The Coding Train.
Step 4: Change the background color
- Change the color of the canvas background to a sky blue color by changing the arguments in the
background()function tobackground(135, 206, 235). - Add comments to describe this line of code.
- Have the Auto-refresh box checked to update the canvas automatically.
Your code can look like this:
background() and other p5.js commands, like shapes, are also functions. The background() function specifically changes the color of the background of the canvas. According to the p5.js reference page for background(), the three arguments seen in the code above represent values for red, green, and blue that correspond to the blue color seen on the canvas.
There are over 10 million combinations of numbers for red, green, and blue that correspond to colors you can use. These are known as RGB color codes. In the code above we see that the value for R is 135, the value for G is 206, and the value for B is 235. This corresponds to the light blue color shown on the canvas.
- View this example to explore how changes in R, G, and B values in
background()affect the color of the canvas.
Visit the p5.js reference pages for background() and color to learn about more ways you can change the background color of the canvas.
Tip
Use Google’s Color Picker to search for the code that can set the background to any color. Find the color you would like to use, copy the numbers in the box labeled RGB, and paste them into background().
Step 5: Draw shapes on the canvas
- Draw a sun in the top-right corner of the canvas using the
circle()function. - Add a semicolon (
;) to end this line of code. - Add a comment that describes this line of code.
Be sure to add shapes within the curly brackets (in the code block) of the draw() function, and have the Auto-refresh box checked to update the canvas automatically.
Your code should look like this:
Some shape functions, such as circle(), use numbers that describe the horizontal location (x-coordinate), vertical location (y-coordinate), and size (width and height) of a circle. The x- and y-coordinates indicate the center point (x, y) of the circle (see diagram below).
- The first argument in the
circle()function used in the code example above, the number 550, is the x-coordinate of the center point. This means that the center point is located 550 pixels to the right of the left edge of the canvas. - The second argument, the number 50, is the y-coordinate of the center point. This means that the center point is located 50 pixels below the top edge of the canvas.
- The third argument, the number 100, is the diameter of the circle. This means that the circle is 100 pixels wide and 100 pixels high.
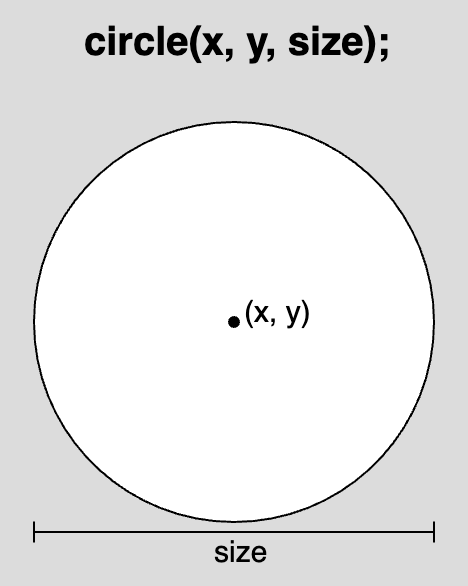
A diagram of a circle with a center point at (x,y) and diameter “size”. The syntax for the syntax for using the circle function is displayed above the diagram as: “circle(x, y, size);”
Visit the p5.js reference page for circle() to learn more.
p5.js Canvas Coordinates
The canvas comes with an invisible coordinate system that begins at a horizontal location of 0 and vertical location of 0 in the top-left corner.
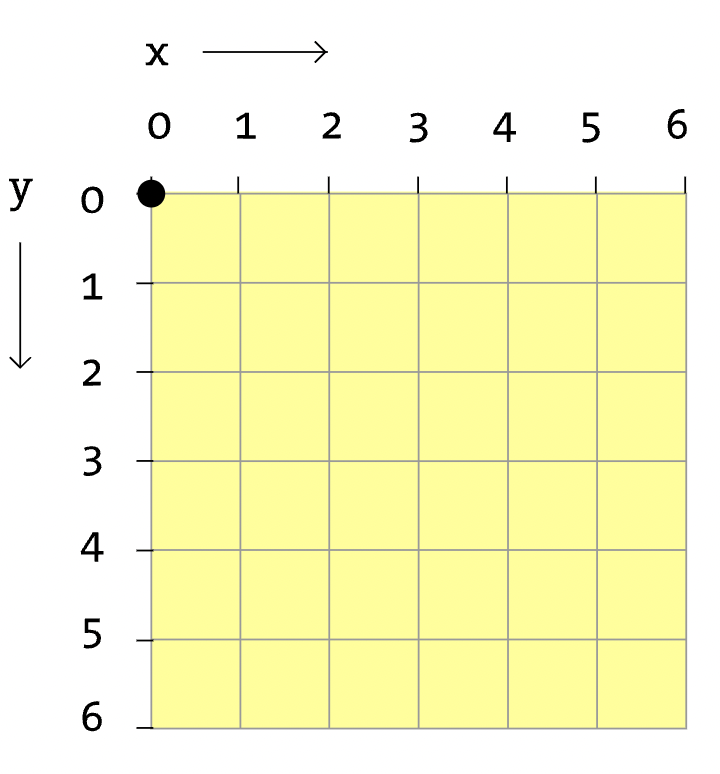
A diagram of a HTML <canvas> element shows a grid pattern overlay with the horizontal axis representing x-coordinates, the vertical axis representing y-coordinates, and each intersection of the grid representing specific (x,y) coordinate pairs. An arrow along the x-axis shows that x-coordinates increase as they move to right on the canvas. An arrow along the y-axis shows that y-coordinates increase as they move down on the canvas.
As an object on the canvas moves to the right of this point, its horizontal location increases. As an object on the canvas moves down from this point, its vertical location increases. As an object moves to the left on the canvas, its x-coordinate decreases; as an object moves up on the canvas, its y-coordinate decreases. The following examples display values for the x- or y-coordinates of a circle as its position changes on the canvas:
- This example displays the x-coordinate of a circle as it moves horizontally on the canvas.
- This example displays the y-coordinate of a circle as it moves vertically on the canvas.
The maximum values for the horizontal and vertical position of the canvas are set by the createCanvas() function. The first number in createCanvas() is the x-coordinate of the right edge, and the second number is the y-coordinate of the bottom edge.
Learn more about the HTML canvas coordinate system and shapes on this p5.js reference page.
Step 6: Color shapes and outlines on the canvas
- Color the sun by adding
fill("yellow")on the line abovecircle(). - Color the outline of the sun by adding
stroke("orange")on the line abovecircle(). - Change the thickness of the outline by adding
strokeWeight(20)on the line abovecircle(). - Add comments to describe the code.
Be sure to add fill(), stroke(), and strokeWeight() within draw()’s code block, on the lines BEFORE a shape is drawn.
Your code should look like this:
The In the p5.js Web Editor, you can search for different colors to use in After coloring a circle yellow using fill(“yellow”), a user coding in the p5.js Web Editor clicks on the yellow square that appears next to the HTML color “yellow”. This reveals the color tool which is used to select a red color. The user then clicks the code editor causing the color of the circle to change from yellow to red.fill() function sets the color for any shape on the canvas, and the stroke() function sets the color for lines and outlines. They both use the same arguments that background() uses. The code above uses an HTML color name as the arguments for fill() and stroke(); we can also use RGB and HEX color codes. The strokeWeight() function uses a number to set the thickness for lines, outlines, and points that are below it; the default strokeWeight() is 1 pixel. In the code above, strokeWeight(20) sets the circle’s outline to 20 pixels.fill(), stroke(), and background() by clicking on the small colored box next to the color’s name! Type an HTML color name as an argument, and the box will appear. Color names are string data types and are therefore surrounded by quotation marks ("").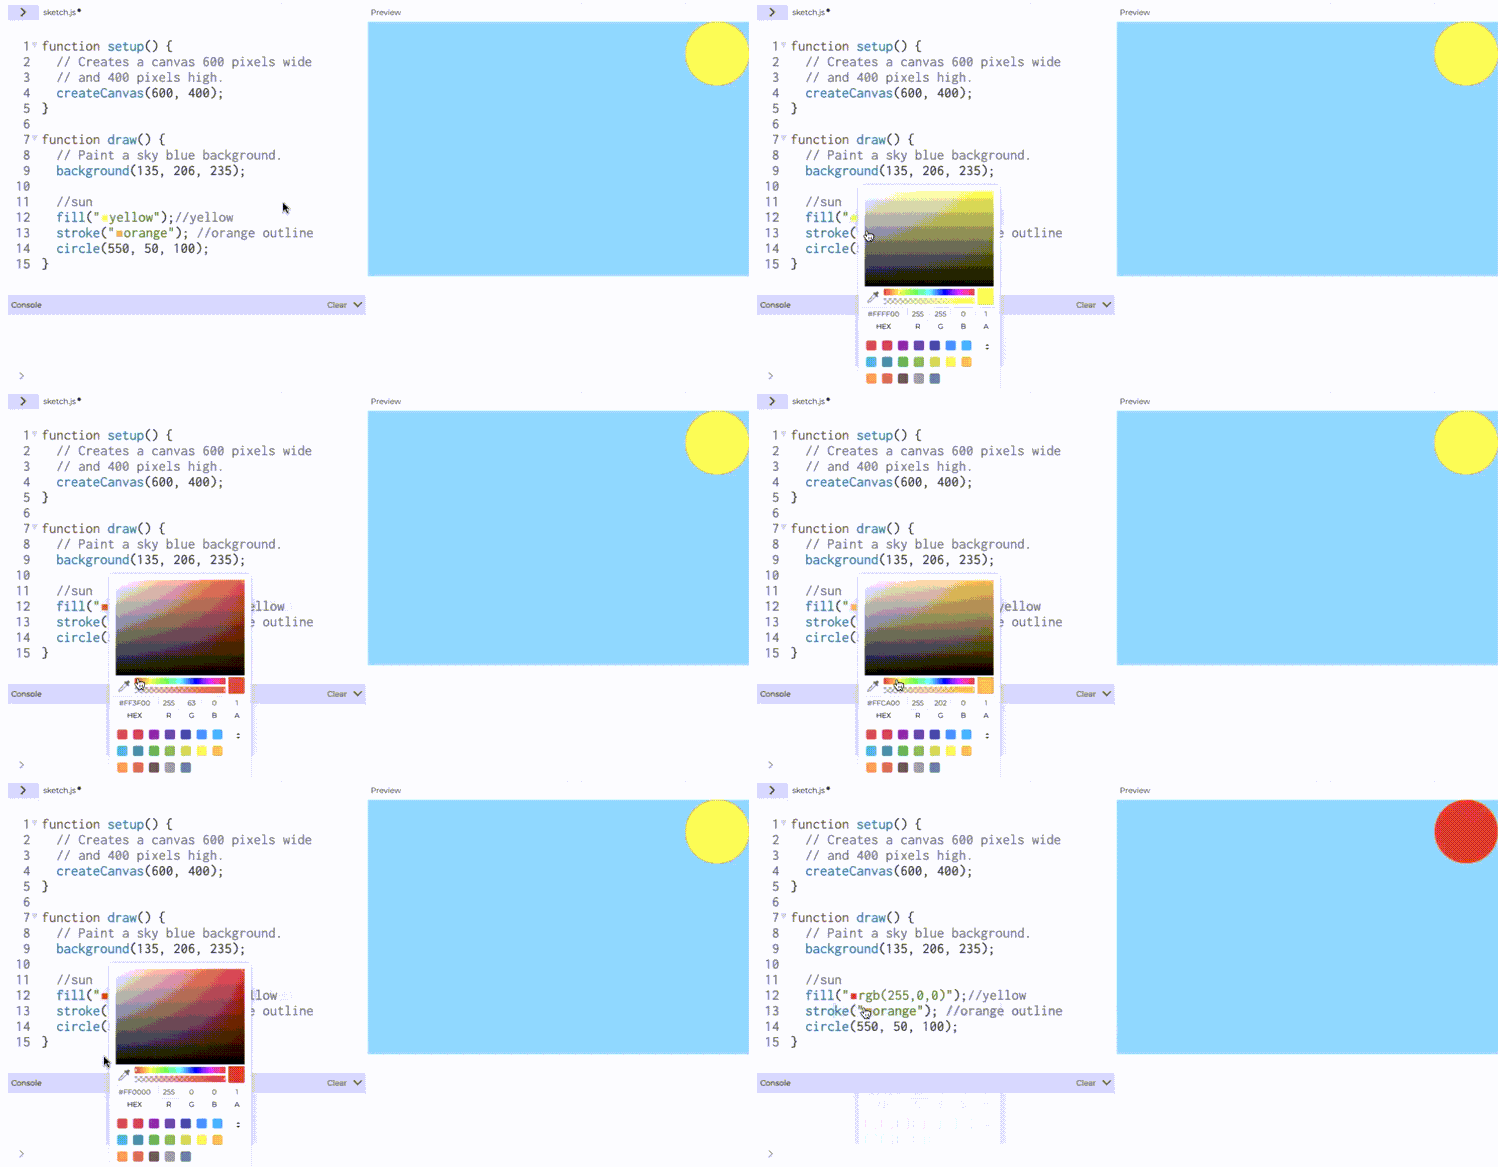
Fill Order
The default value for fill() is white. This means that if fill() never appears in draw(), all shapes will be white by default. To change the color of any shape on the canvas, you must call fill() before drawing the shape. The default value for stroke() is black. To change the color and shape of the outline, stroke() and strokeWeight() must be called before the shape is drawn. When drawing multiple shapes on the canvas, call fill(), stroke(), and strokeWeight() each time the color of a shape or outline changes.
- See this sketch for an example.
Visit the color reference page to learn more about fill(), stroke(), and strokeWeight(). Use the p5.js Web Editor’s color tool or Google’s Color Picker to search for color codes to use in fill(), stroke(), and background().
Step 7: Draw and color more shapes on your canvas
- Draw grass on the bottom half of the canvas:
- Reset the values for the outline of shapes by adding
stroke(0)andstrokeWeight(1)below the code for the sun. - Add a rectangle shape to your canvas using
rect(0, 200, 600, 200). - Add
fill("green")on the line above the rectangle statement to color the rectangle green. - Add a comment that describes the lines of code that create the grass.
- Reset the values for the outline of shapes by adding
- (Optional) Add more details to your landscape using shapes and colors. Click on the shape functions below to learn how to include them in your sketch:
rect() uses numbers that describe the horizontal location (x-coordinate), vertical location (y-coordinate), width and height of a rectangle. The x- and y-coordinates (x, y) indicate the top left point of the rectangle (see the diagram below).
- The first argument in the
rect()function used in the code example above, the number 0, is the x-coordinate. This means that the top left corner of the rectangle is on the left edge of the canvas. - The second argument, the number 200, is the y-coordinate. This means that the top left corner of the rectangle is 200 pixels below the top edge of the canvas.
- The third argument, the number 600, is the width of the rectangle. This means that the rectangle is 600 pixels wide.
- The fourth argument, the number 200, is the height of the rectangle. This means that the rectangle is 200 pixels tall.
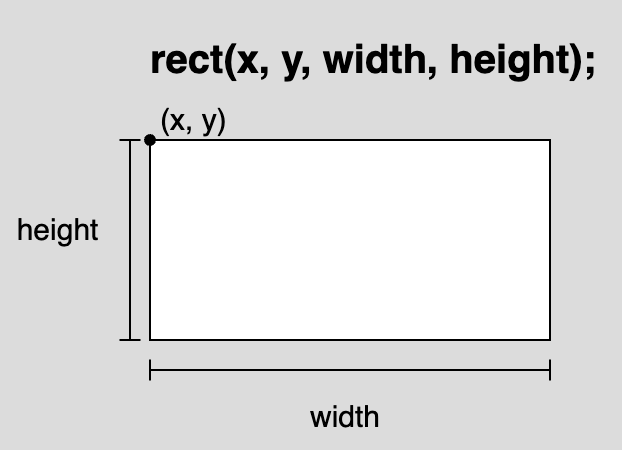
A diagram of a rectangle with a horizontal length labeled “width”, vertical length labeled “height”, and a point in the top left corner labeled “(x,y)”. The syntax for using the rect() function is displayed above the diagram as: “rect(x, y, width, height);”
Visit the p5.js reference pages for rect(), simple shapes, and color to learn more.
Step 8: Add emojis
- Add a flower emoji and a ladybug emoji (or any other emojis you like) to your landscape:
- Draw a flower on the canvas using
text("🌸", 100, 250); - Draw a ladybug on the canvas using
text("🐞", 300, 250);- The emojis you select must be surrounded by quotation marks (for example,
"🌸"). - See the following instructions on how to insert an emoji using your keyboard:
- The emojis you select must be surrounded by quotation marks (for example,
- Adjust the size of the flower and ladybug using
textSize(75)on the line before the emojis are drawn. - Add comments that describe the lines of code that create the flower and ladybug.
- Make sure you press the Play button or have the Auto-refresh box checked to update the canvas.
- Draw a flower on the canvas using
Be sure to add textSize() and text() within the draw()’s code block AFTER the lines of code that draw the grass. If text() appears before rect() in the code, and is placed where the rectangle is drawn on the canvas, there is a chance that the text will be hidden behind the rectangle! See the Drawing Order section below for more explanation on how overlap can happen.
Your code should look like this:
text() uses a string, which is any text within quotation marks (""), and numbers that describe the x-coordinate and y-coordinate of the text. The x- and y-coordinates (x, y) indicate the bottom-left point of the text box (see the diagram below).
- The first argument in the
text()function used in the code example above, the string"🌸", is the text that will appear on the canvas. All strings used in p5.js must be within quotation marks (""). - The second argument, the number 100, is the x-coordinate. This means that the bottom-left corner of the text box is 100 pixels to the right of the left edge of the canvas.
- The third argument, the number 250, is the y-coordinate. This means that the bottom-left corner of the text box is 250 pixels below the top edge of the canvas.
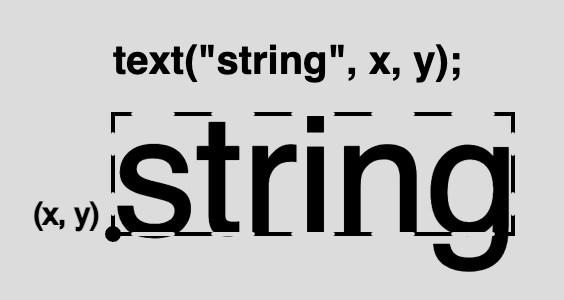
A diagram with the word “string” inside a rectangle outlined by dashed lines, and a point in the bottom left corner labeled “(x,y)”. The dashed outline represents the invisible box that encloses the text, and the point “(x,y)” represents the coordinates that describe its location on the HTML <canvas>.
textSize() uses a number to describe the size, in pixels, for any text() function that appears after it is called. Be sure to use textSize() before you call the text() function if you wish to change the size of the text that appears on the canvas.
- See this example for differences in text size.
Drawing Order
Since draw() executes the code within the brackets over and over again, shapes are drawn on the canvas like layers. Code that appears first will be drawn first, and code that appears further down in draw() will be drawn after. This is why we must set fill(), stroke(), and textSize() before we add shapes or text to the canvas. p5.js needs to know the color or size of shapes and text before they are drawn. This also allows for overlapping shapes and can sometimes hide shapes behind others! Be sure to check the x- and y-coordinates of your shapes to see if they are behind other shapes.
See these sketches for examples of layering: overlapping shapes (hidden) and overlapping shapes
Visit the reference pages for text(), textSize(), and draw() to learn more.
Data Types
Some functions in p5.js need arguments that are string data types, while other functions need arguments that are number data types.
- Strings: represented by text and always surrounded by quotation marks (
"") - Numbers: represented by a number
For example:
circle()uses 3 numbers: a number that represents its x-coordinate, a number that represents its y-coordinate, and a number that represents its size in pixels.text()uses a string that represents the text displayed, and 2 numbers: a number that represents its x-coordinate and a number that represents its y-coordinate.fill(),stroke(), andbackground()use both numbers and strings:- 1 number for gray-scale color
- 3 numbers separated by commas for RGB colors
- a string with an HTML color name or HEX color values
Step 9: Make it interactive!
- Change the x- and y-coordinate for the ladybug emoji to
mouseX,mouseY.text("🐞", mouseX, mouseY);
- Move your mouse pointer across the canvas and see how the ladybug follows your mouse pointer location!
- Make sure you press the Play button or have the Auto-refresh box checked to update the canvas.
- Add comments to describe how the ladybug can move with the mouse pointer.
Your code should look like this:
mouseX and mouseY are built-in variables that come with the p5.js library – they are referred to as system variables. Variables store values in them that can be used later in a sketch. They are also helpful to use when you know the value of something, such as x- and y-coordinates, is changing. mouseX and mouseY specifically store the x- and y-coordinates of the mouse pointer as it is dragged over the canvas. You can use mouseX and mouseY as any argument that requires a number!
See some of these examples of how you can use mouseX and mouseY in a sketch:
- Display x- and y-coordinates of mouse (mouseX and mouseY)
- mouseX and mouseY changes color
- mouseX and mouseY changes size
Visit the p5.js reference pages for mouseX and mouseY to learn more! Be sure to review the p5.js coordinate system by visiting the p5.js reference page for the canvas coordinate system and shapes. Explore other system variables included in the p5.js reference:
width:The width of the canvasheight:The height of the canvaspmouseX:The previous x-coordinate of the mousepmouseY:
Errors
It is easy to spell function names wrong or forget a comma. Syntax rules help the computer interpret code. When a “rule” is broken, an error message will appear in the console (for example, if circle() is spelled wrong). These errors are commonly referred to as “bugs.” The console displays messages from the editor with details about any mistakes you might have made. When your code does not execute correctly, there might be a bug in your code! Visit the Field Guide to Debugging for examples of common errors and how to fix them.
For more information, watch this video from The Coding Train.
Next steps
- Next Tutorial: Variables and Change Tutorial
- Begin your next sketch:
- You can duplicate this template to help you place shapes and text on the canvas!
- Click on the template link, click File, then Duplicate.
- Rename your project and save.
- You can duplicate this template to help you place shapes and text on the canvas!
Previous step
Resources
- Video: The Coding Train 1.2: Tutorial
- Video: The Coding Train 1.3: Shapes and Drawing
- Video: The Coding Train 1.4: Color
- Video: The Coding Train 1.5: Errors and Console
- Video: The Coding Train 1.6: Code Comments
- Video: The Coding Train 2.1: Variables in p5.js (mouseX & mouseY)
- p5.js Reference
- HTML color name
- HEX color values
