Analyzing the instantaneous loudness of a sound doesn’t always provide enough information to create rich visual outputs (see the previous example, Measuring Amplitude).
Sometimes we will want to measure the loudness of individual frequency bands to create more complex visualizations. To do this, we’ll use the p5.FFT class, which returns a “spectral analysis” of the input signal.
The analyze method returns individual values for each ‘frequency band’ which we can use to draw distinct paths for the lows, mids, and high frequency ranges of a sound.
Using the waveform method we can also retrieve the last 1024 sample values in order to visualize the waveform the sound’s waveform.

Visualizing Sound: Edited and maintained by p5.js Contributors and Processing Foundation. Licensed under CC BY-NC-SA 4.0.
Related Examples
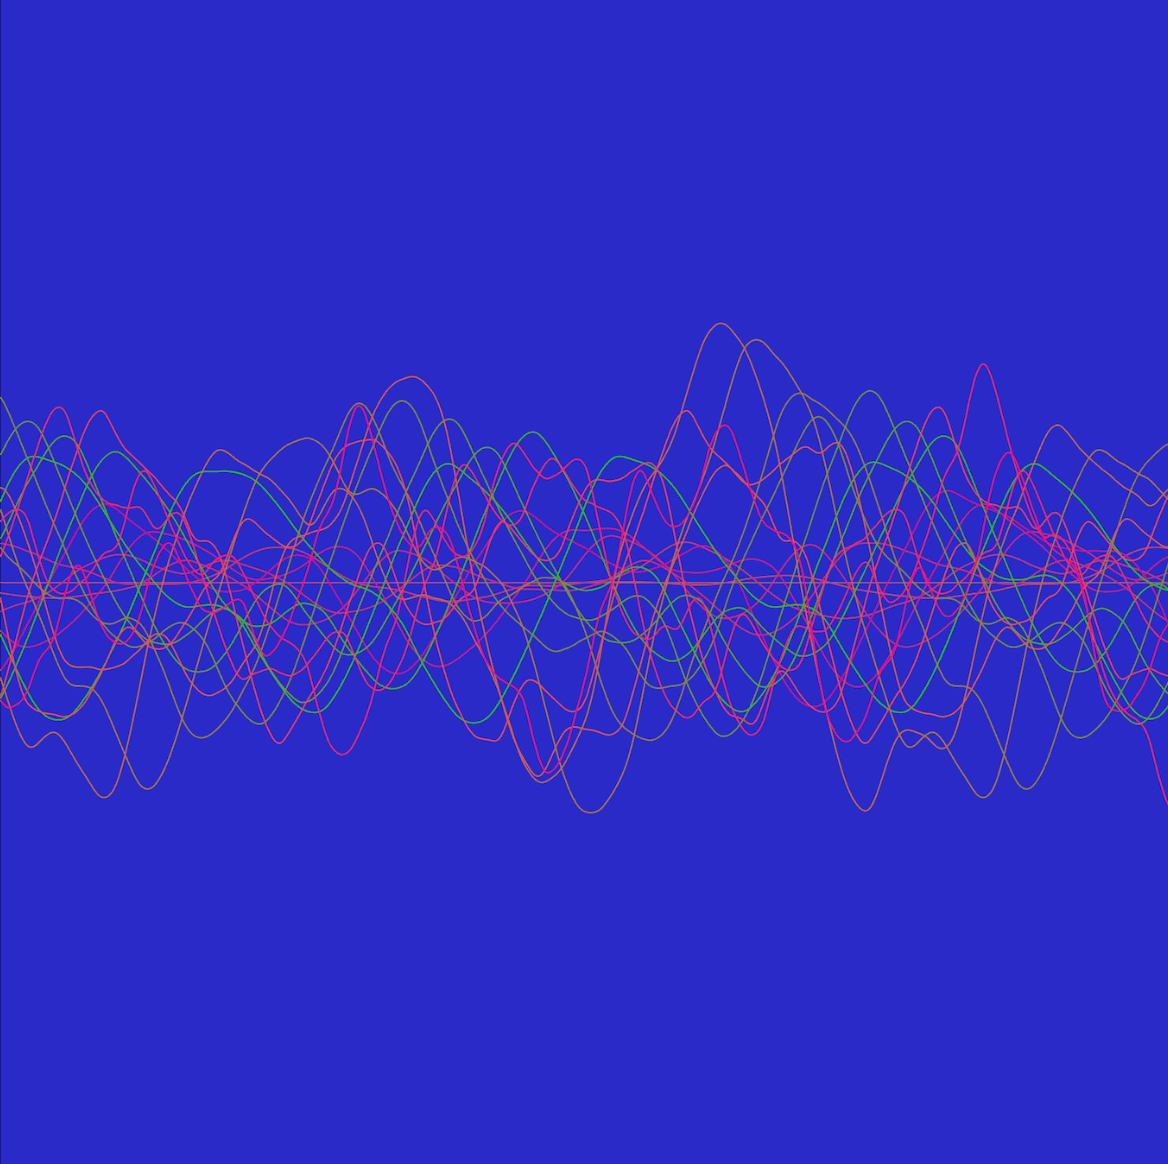
An image of sound waves rendered in p5.js.
Making a Beep
Creating tones with an Oscillator.
An image of sound waves rendered in p5.js.
Filtering Sound
Simulate the sound of waves and wind with white noise.
An image of sound waves rendered in p5.js.
Playing Melodies
Create melodic music using an array of pitch values.
An image of sound waves rendered in p5.js.
Echo Synth
Trigger a short sound with an echo effect.
An image of sound waves rendered in p5.js.
Sample Playback
Load a soundfile and change its properties.
An image of sound waves rendered in p5.js.
Measuring Amplitude (Visualization)
Analyze the amplitude of sound with p5.Amplitude.
An image of sound waves rendered in p5.js.
Visualizing Sound
Spectral analysis for audio-responsive animations.
An image of sound waves rendered in p5.js.
Connecting to ToneJS
Working with AudioContexts and cross-library synthesis.