欢迎来到 p5.js!刚开始接触 p5.js,想要学习如何创建交互式草图吗?跟随本教程创建一个简单的交互式风景画。你将学习如何:
- 更改画布大小和背景颜色
- 添加、自定义和着色形状与文本
- 通过让草图响应鼠标指针位置来添加简单交互性
- 注释代码
- 使用 p5.js 参考页面来了解更多信息
先决条件
在开始之前,你应该能够:
- 登录 p5.js 网页编辑器 并保存一个新项目
或者
- 在 VS Code(或其他代码编辑器)中创建并保存一个新的 p5.js 项目
有关在 p5.js 网页编辑器 或 VS Code 中创建和保存项目的分步指南,请访问 设置你的环境。
步骤 1:命名并保存一个新的 p5.js 项目
- 创建一个新的 p5.js 项目,给它命名,然后保存它。
使用 p5.js 网页编辑器:
- 登录 p5.js 网页编辑器。
- 点击铅笔图标,在出现的文本框中输入”Interactive Landscape”(交互式风景画)作为项目名称。。
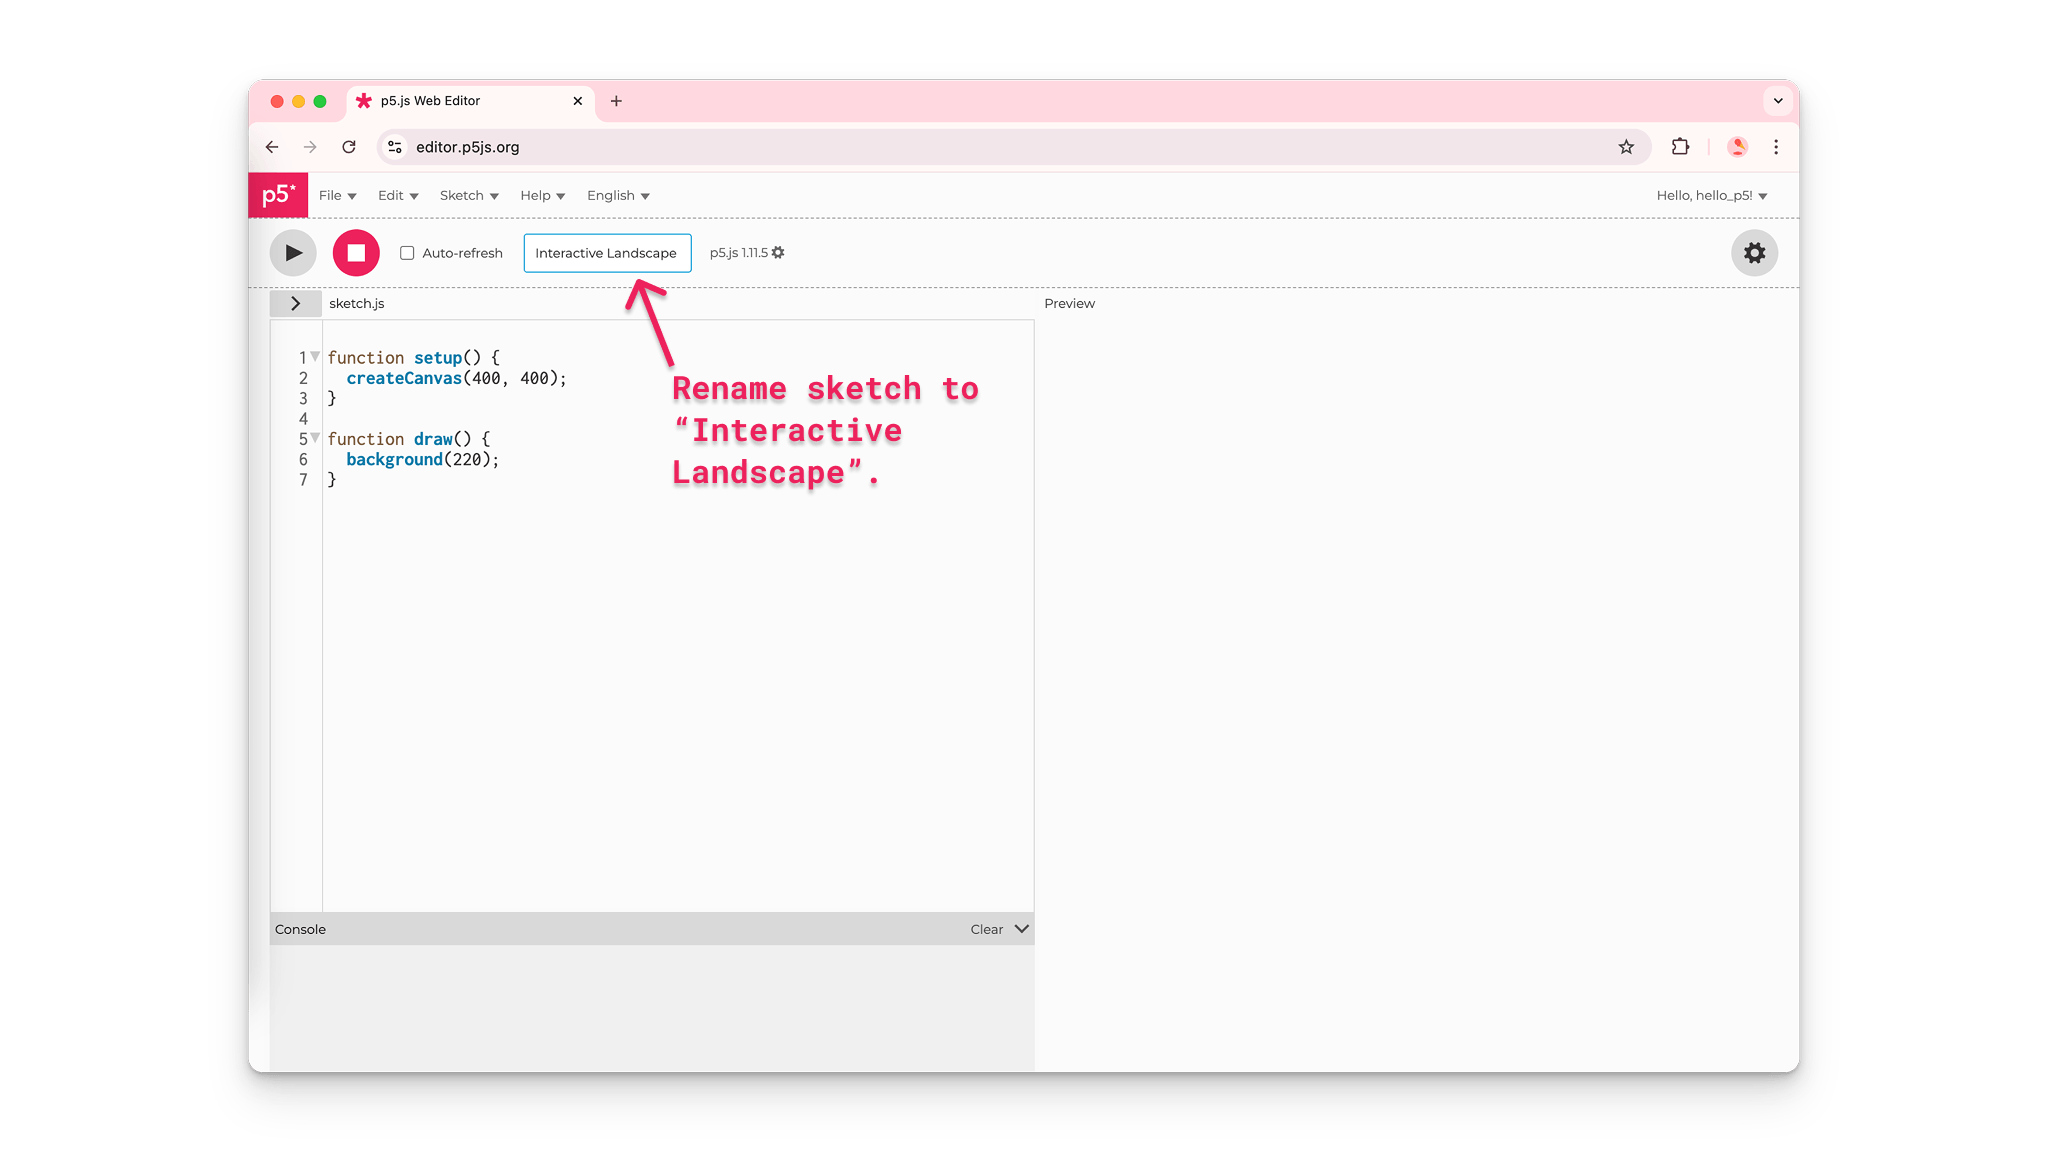
p5.js 网页编辑器用户将新项目命名为"Interactive Landscape"
- 点击文件,然后选择保存。
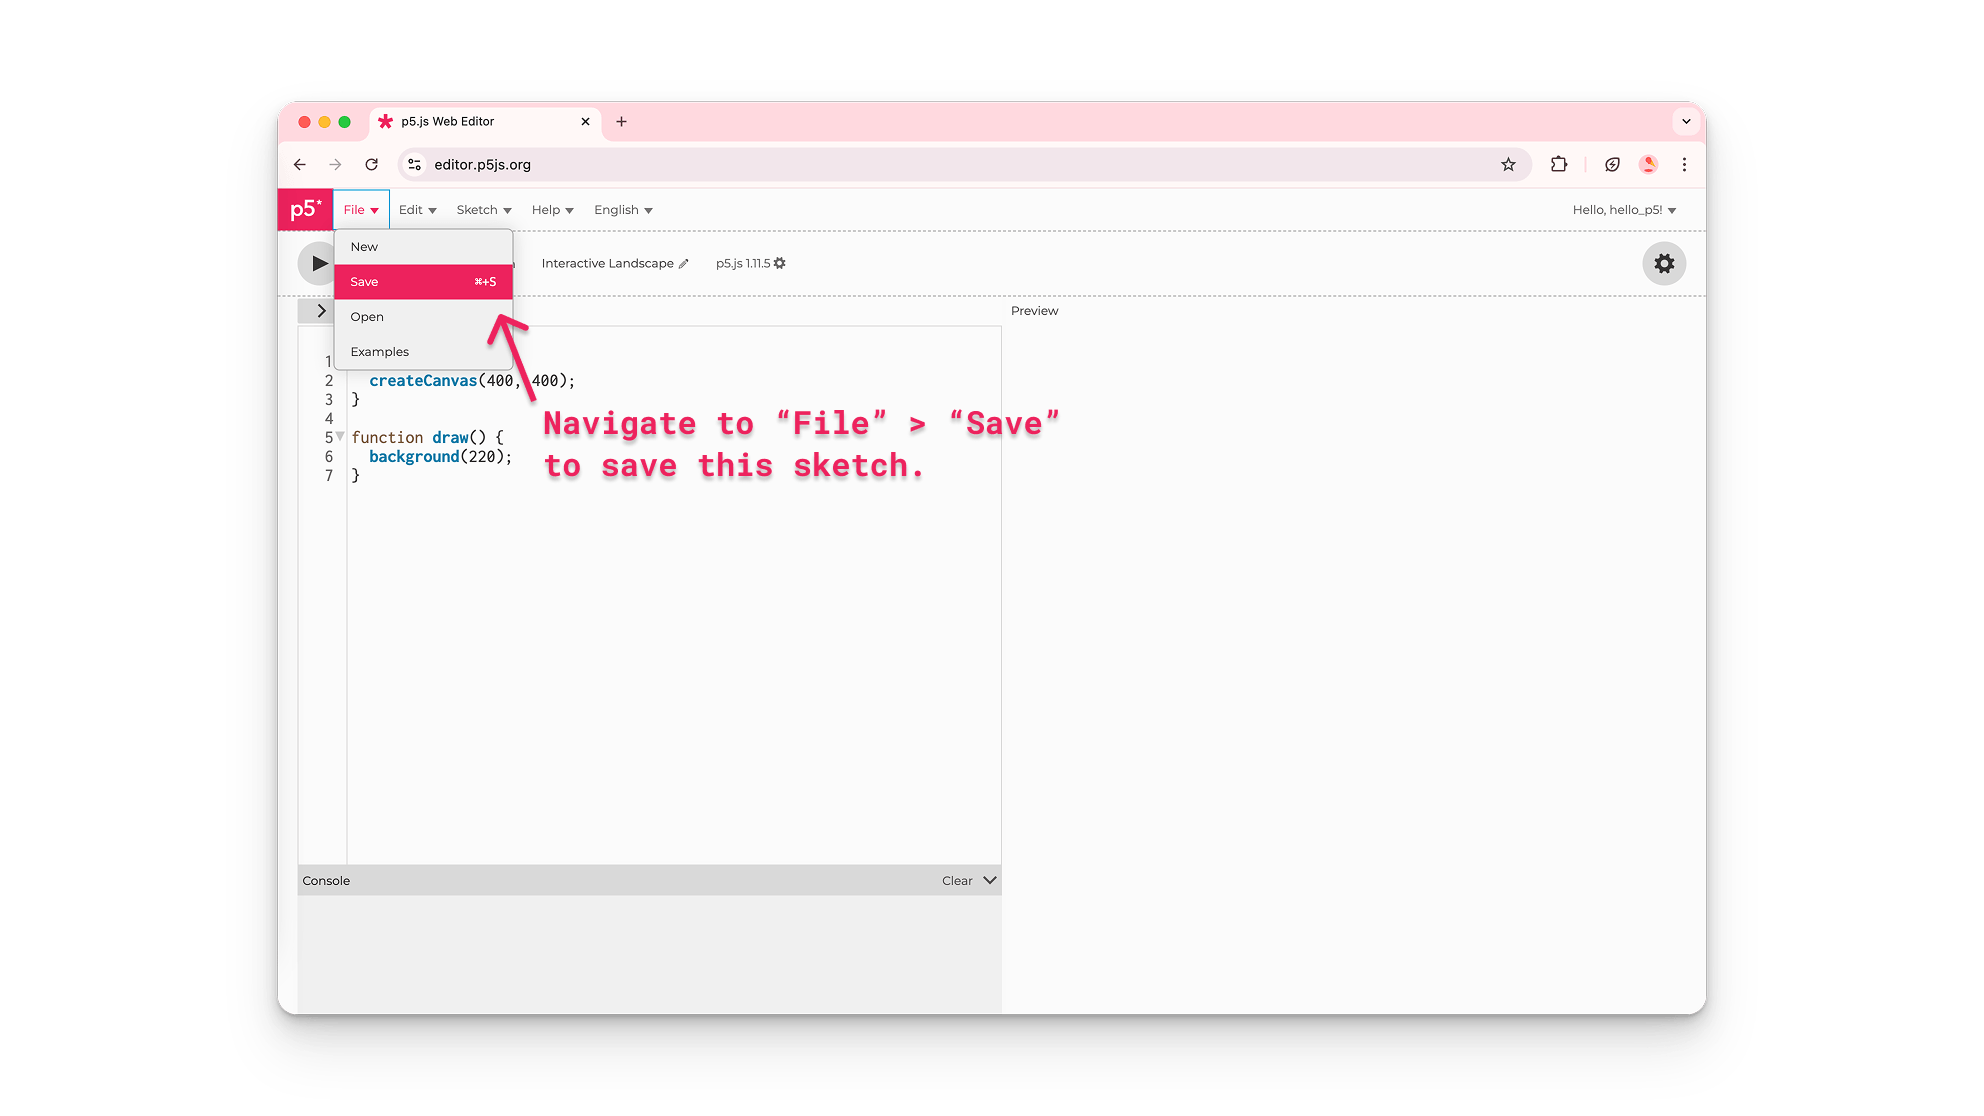
p5.js 网页编辑器用户保存他们的新项目"Interactive Landscape"
- 通过导航到你保存的草图画廊来确认项目已保存:
- 点击文件,然后选择打开。
- 最近保存的草图会显示在项目列表的最上方。
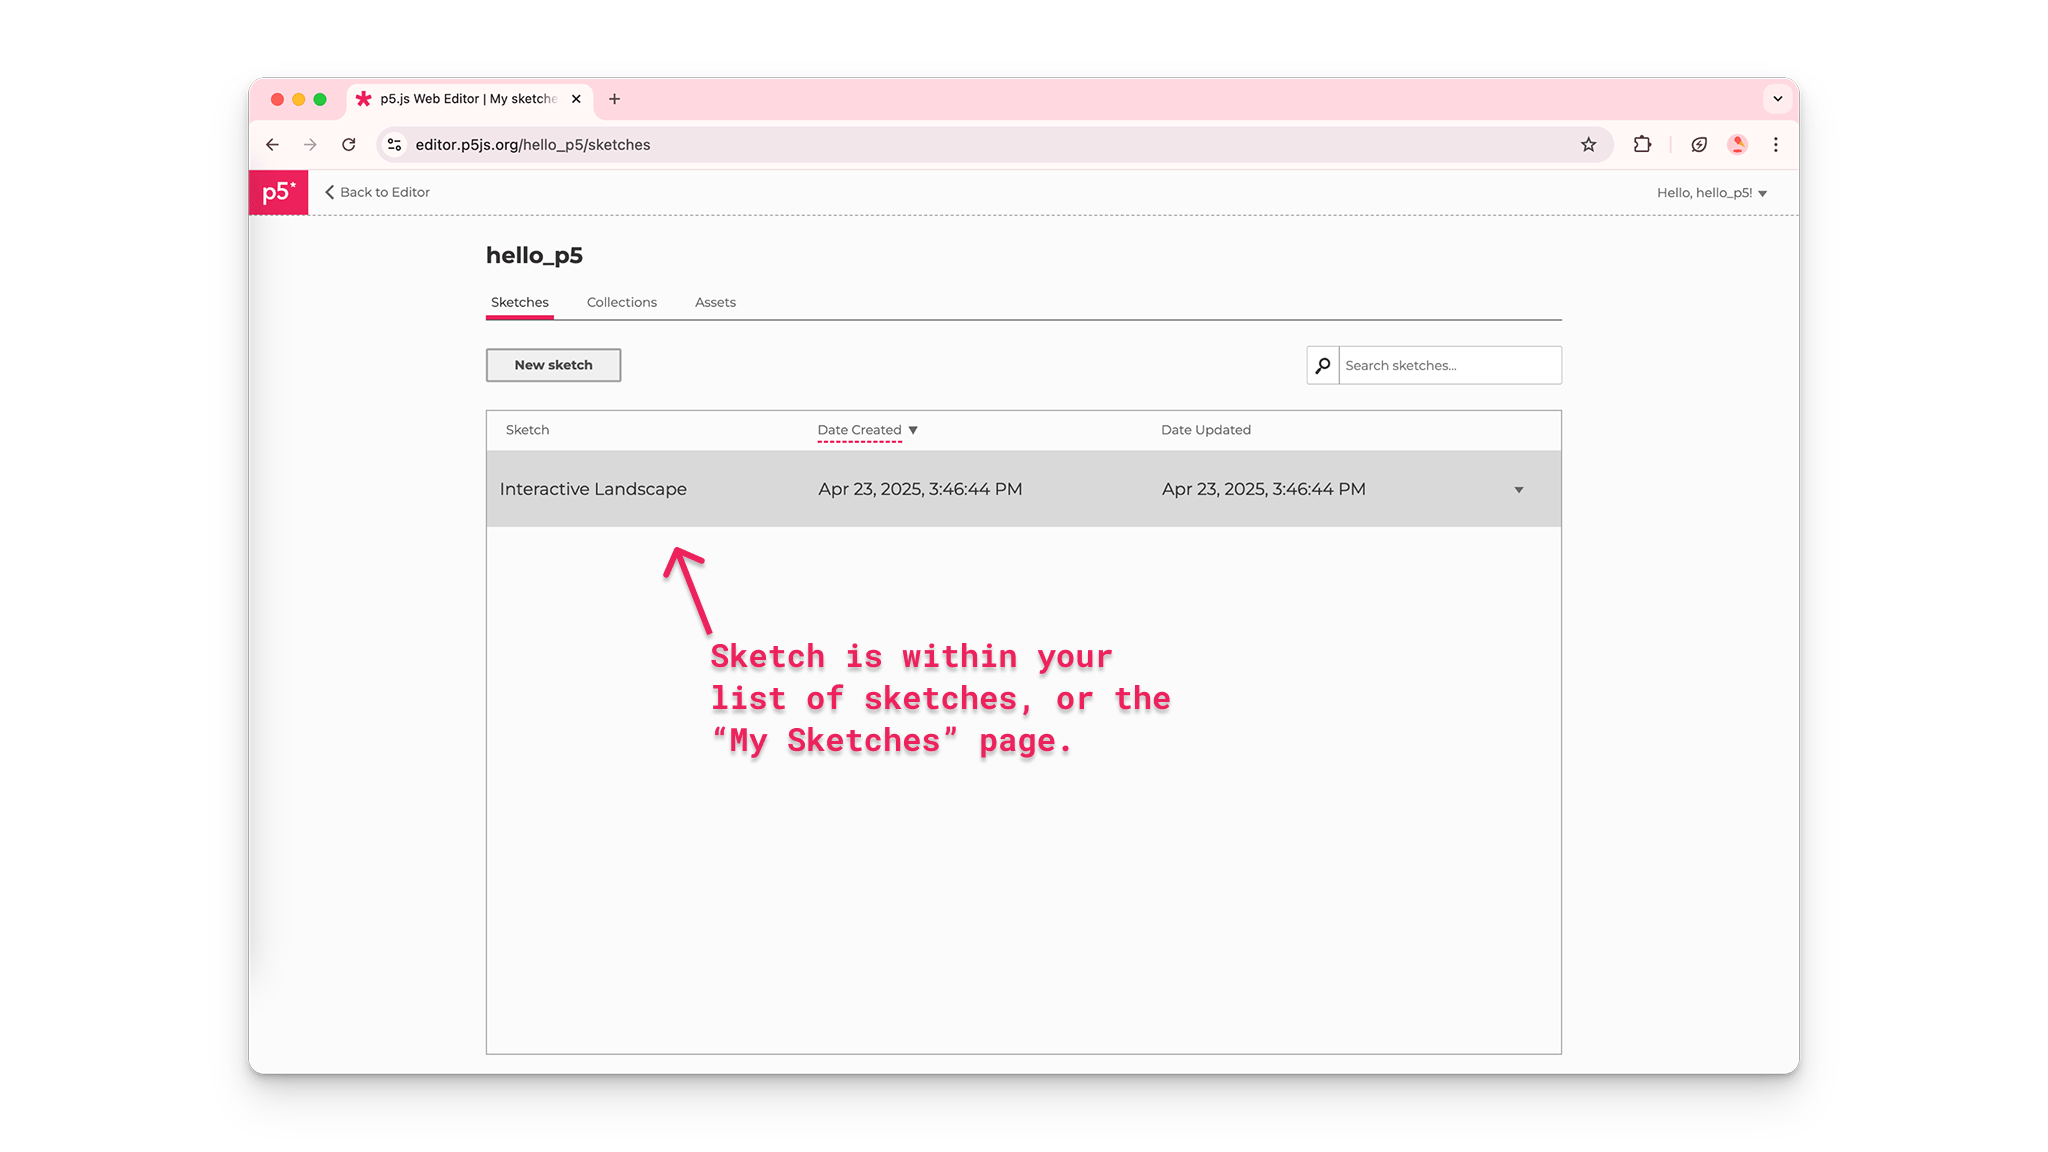
p5.js 网页编辑器用户在保存的草图画廊中找到他们的项目"Interactive Landscape"
默认代码
所有 p5.js 项目都包含 p5.js 库,以及三个文件:index.html、style.css 和 sketch.js。通过在 sketch.js 文件中添加代码来对画布进行更改。新的 p5.js 项目在 sketch.js 文件中以以下代码开始:
    function setup() {
  createCanvas(400, 400);
}
function draw() {
  background(220);
}
每个 sketch.js 文件都以两个主要函数开始:setup() 和 draw()。
函数是执行特定任务的指令序列。
当 sketch.js 中的代码被执行时:
setup()被调用并运行一次。它可以用于为你的项目设置默认值。- 在
setup()的花括号({})内,createCanvas(400, 400)创建一个 400 像素宽、400 像素高的 HTML 画布,你可以在预览窗口中看到它。
- 在
draw()在setup()之后被直接调用,并每秒执行其花括号内的代码 60 次,直到程序停止或调用noLoop()函数。- 在
draw()的花括号内,也称为draw()代码块,background()函数设置画布背景的颜色。默认值(220)将画布颜色设置为灰色。
- 在
访问 p5.js 参考页面了解 setup()、draw()、createCanvas() 和 background() 的更多信息。
步骤 2:更改画布大小
- 修改
createCanvas()的参数,将画布大小更改为 600 像素宽、400 像素高。点击播放以在预览窗口中查看更改。 - 确保你点击了播放按钮或勾选了自动刷新框以更新画布。
你的代码应该如下所示:
    function setup() {
  createCanvas(600, 400);
}
function draw() {
  background(220);
}
提示
在 p5.js 网页编辑器 中点击播放并勾选”自动刷新”旁边的框,这样在你添加代码时,画布会自动持续更新。勾选此框后,你每次更改草图时都无需点击播放按钮。
步骤 3:使用注释描述代码
- 编写一个描述
createCanvas(600, 400)作用的注释。
你的代码可以如下所示:
    function setup() {
  // 创建一个 600 像素宽
  // 400 像素高的画布。
  createCanvas(600, 400);
}
function draw() {
  background(220);
}
注释
在你的草图中使用注释可以帮助你记住每行代码的用途。由于 JavaScript 不会读取注释,它们是向其他查看你代码的人传达思路,或提醒自己代码功能的好方法。
- 在草图中的任何位置使用两个正斜杠(
//注释)来嵌入单行注释。
语句
sketch.js 文件是用JavaScript编写的,其中每行代码称为一个语句。每个语句以分号(;)结尾。最佳实践是:在 sketch.js 文件中,每条语句末尾都加上分号。你不应该在函数和 if 语句的花括号后包含分号。
有关注释和语句的更多信息,请观看 The Coding Train 的这个视频。
步骤 4:更改背景颜色
- 把
background()函数中的参数更改为background(135, 206, 235),即可将背景色设为天蓝色。 - 添加注释来描述这行代码。
- 勾选自动刷新框以自动更新画布。
你的代码可以如下所示:
background() 和其他 p5.js 命令(如形状)也是函数。background() 函数专门更改画布背景的颜色。根据 p5.js 参考页面 background() 的说明,上面代码中看到的三个参数代表红、绿、蓝的值,对应于画布上显示的蓝色。
红、绿、蓝的数字组合超过一千万种,你可以用它们调配出各种颜色。这些被称为 RGB 颜色代码。在上面的代码中,我们看到 R 的值是 135,G 的值是 206,B 的值是 235。这对应于画布上显示的浅蓝色。
- 查看这个示例,探索
background()中 R、G 和 B 值的变化如何影响画布的颜色。
访问 p5.js 参考页面了解 background() 和 color 的更多信息,以了解更多更改画布背景颜色的方法。
提示
使用 Google颜色选择器 搜索任意颜色,获取对应的代码。找到你想使用的颜色,复制标记为 RGB 的框中的数字,并将它们粘贴到 background() 中。
步骤 5:在画布上绘制形状
- 使用
circle()函数在画布的右上角绘制一个太阳。 - 添加一个分号(
;)来结束这行代码。 - 添加一个描述这行代码的注释。
注意
确保在 draw() 函数的花括号内(代码块中)添加形状,并勾选自动刷新框以自动更新画布。
你的代码应该如下所示:
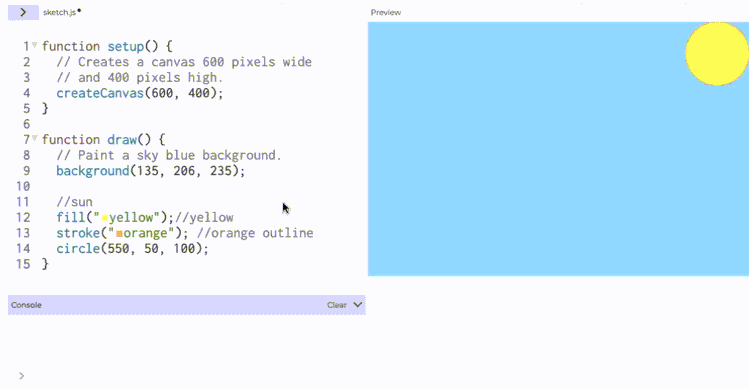
一些形状函数,如 circle()需要传入数字参数,分别描述圆心的水平位置(x 坐标)、垂直位置(y 坐标)以及圆的大小(直径)。x 和 y 坐标表示圆的中心点(x、y)(见下图)。
- 上面代码示例中
circle()函数的第一个参数是 550,表示圆心的 x 坐标,即圆心位于画布左边缘右侧 550 像素处。 - 第二个参数,数字 50,是中心点的 y 坐标。这意味着中心点位于画布顶部边缘下方 50 像素处。
- 第三个参数,数字 100,是圆的直径。这意味着圆的宽度为 100 像素,高度为 100 像素。
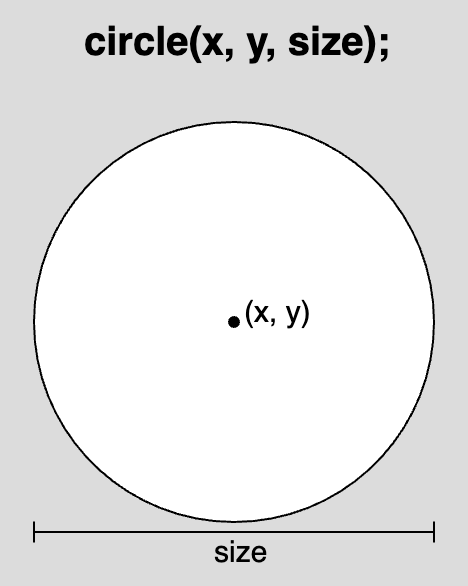
一个圆的示意图,中心点位于 (x,y),直径为"size"。上面显示了使用 circle 函数的语法:"circle(x, y, size);"
访问 p5.js 参考页面了解 circle() 的更多信息。
p5.js 画布坐标
画布内置了一个不可见的坐标系,原点(0,0)位于左上角。
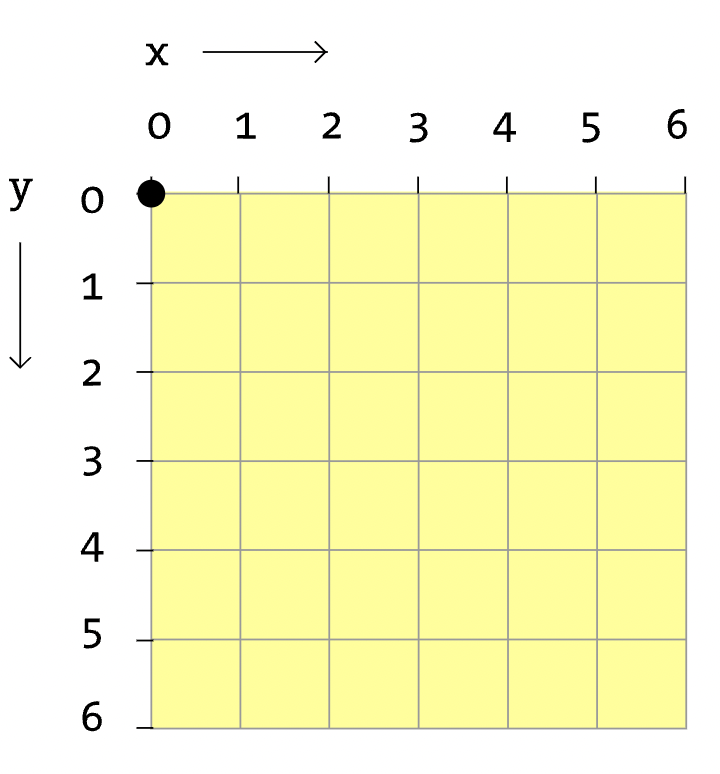
HTML <canvas> 元素示意图显示了一个网格图案叠加层,水平轴代表 x 坐标,垂直轴代表 y 坐标,网格的每个交点代表特定的 (x,y) 坐标对。沿 x 轴的箭头显示 x 坐标随着在画布上向右移动而增加。沿 y 轴的箭头显示 y 坐标随着在画布上向下移动而增加。
当画布上的对象向右移动时,其水平位置增加。当画布上的对象向下移动时,其垂直位置增加。当对象在画布上向左移动时,其 x 坐标减小;当对象在画布上向上移动时,其 y 坐标减小。以下示例显示圆在画布上位置变化时的 x 或 y 坐标值:
画布的最大宽度和高度由 createCanvas() 函数设定。createCanvas() 中的第一个数字是右边缘的 x 坐标,第二个数字是底部边缘的 y 坐标。
在这个 p5.js 参考页面上了解更多关于 HTML 画布坐标系和形状的信息。
步骤 6:为画布上的形状和轮廓着色
- 通过在
circle()上方一行添加fill("yellow")来为太阳着色。 - 通过在
circle()上方一行添加stroke("orange")来为太阳的轮廓着色。 - 通过在
circle()上方一行添加strokeWeight(20)来更改轮廓的粗细。 - 添加注释来描述代码。
注意
确保在 draw() 的代码块内,在绘制形状之前的行上添加 fill()、stroke() 和 strokeWeight()。
你的代码应该如下所示:
fill() 函数设置画布上任何形状的颜色,stroke() 函数设置线条和轮廓的颜色。它们都使用与 background() 相同的参数。上面的代码使用 HTML 颜色名称 作为 fill() 和 stroke() 的参数;我们也可以使用 RGB 和 HEX 颜色代码。strokeWeight() 函数接收一个数字参数,用于设置其后绘制的线条、轮廓和点的粗细;默认的strokeWeight() 默认值是 1 像素。在上面的代码中,strokeWeight(20) 将圆的轮廓设置为 20 像素。
提示
在 p5.js 网页编辑器 中,你可以通过点击颜色名称旁边的小彩色框来搜索要在 fill()、stroke() 和 background() 中使用的不同颜色!输入 HTML 颜色名称 作为参数后,颜色选择器就会出现。颜色名称是 字符串 数据类型,因此用引号("")括起来。
使用 fill("yellow") 将圆着色为黄色后,在 p5.js 网页编辑器中编码的用户点击出现在 HTML 颜色"yellow"旁边的黄色方块。这会显示颜色工具,用于选择红色。然后用户点击代码编辑器,导致圆的颜色从黄色变为红色。
填充顺序
fill() 的默认值是白色。这意味着如果 fill() 从未出现在 draw() 中,所有形状默认都是白色的。要更改画布上任何形状的颜色,你必须在绘制形状之前调用 fill()。stroke() 的默认值是黑色。要更改轮廓的颜色和形状,必须在绘制形状之前调用 stroke() 和 strokeWeight()。在画布上绘制多个形状时,每次形状或轮廓的颜色发生变化时,都要调用 fill()、stroke() 和 strokeWeight()。
- 参见这个草图获取示例。
访问颜色参考页面了解有关 fill()、stroke() 和 strokeWeight() 的更多信息。使用 p5.js 网页编辑器的颜色工具或 Google 的颜色选择器 搜索要在 fill()、stroke() 和 background() 中使用的颜色代码。
步骤 7:在画布上绘制并着色更多形状
- 在画布的下半部分绘制草地:
- 通过在太阳代码下方添加
stroke(0)和strokeWeight(1)来把轮廓恢复为默认值。 - 使用
rect(0, 200, 600, 200)向画布绘制一个矩形。 - 在
rect()上方一行添加fill("green")以将矩形着色为绿色。 - 添加一个描述创建草地的代码行的注释。
- 通过在太阳代码下方添加
- (可选)使用形状和颜色为你的风景画添加更多细节。点击下面的形状函数以了解如何将它们包含在你的草图中:
rect() 使用描述矩形的水平位置(x 坐标)、垂直位置(y 坐标)、宽度和高度的数字。x 和 y 坐标(x, y)表示矩形的左上角点(见下图)。
- 上面代码示例中
rect()函数的第一个参数,数字 0,是 x 坐标。这意味着矩形的左上角位于画布的左边缘。 - 第二个参数,数字 200,是 y 坐标。这意味着矩形的左上角位于画布顶部边缘下方 200 像素处。
- 第三个参数,数字 600,是矩形的宽度。这意味着矩形的宽度为 600 像素。
- 第四个参数,数字 200,是矩形的高度。这意味着矩形的高度为 200 像素。
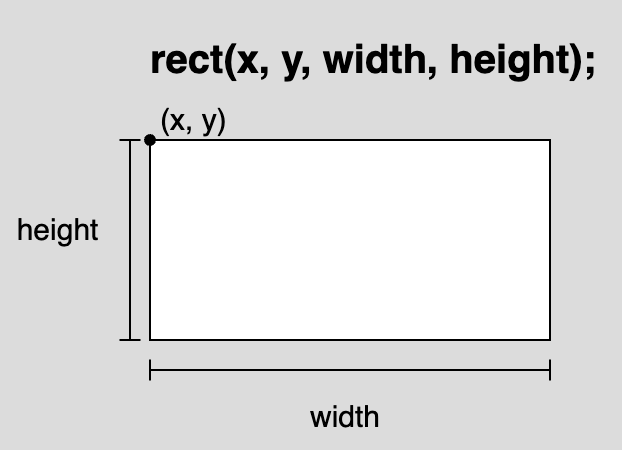
一个矩形的示意图,水平长度标记为"width",垂直长度标记为"height",左上角点标记为"(x,y)"。上面显示了使用 rect() 函数的语法:"rect(x, y, width, height);"
访问 p5.js 参考页面了解 rect()、简单形状 和 颜色 的更多信息。
步骤 8:添加表情符号
- 在风景画中添加花朵表情符号和瓢虫表情符号(或任何其他你喜欢的表情符号):
- 使用
text("🌸", 100, 250);在画布上绘制一朵花 - 使用
text("🐞", 300, 250);在画布上绘制一只瓢虫 - 你选择的表情符号必须用引号括起来(例如,
"🌸")。 - 请参阅以下关于如何使用键盘插入表情符号的说明:
- 在绘制表情符号之前的行上使用
textSize(75)来调整花朵和瓢虫的大小。 - 添加注释来描述创建花朵和瓢虫的代码行。
- 确保你点击了播放按钮或勾选了自动刷新框以更新画布。
- 使用
注意
确保在 draw() 的函数内,将 textSize() 和 text() 添加在绘制草地的代码行之后。如果 text() 写在 rect() 之前,且两者的位置重叠,文本有可能被矩形遮挡!有关重叠如何发生的更多解释,请参阅下面的绘制顺序部分。
你的代码应该如下所示:
text() 使用一个字符串,即引号("")内的任何文本,以及描述文本 x 坐标和 y 坐标的数字。x 和 y 坐标(x, y)表示文本框的左下角点(见下图)。
- 上面代码示例中
text()函数的第一个参数,字符串"🌸",是将显示在画布上的文本。p5.js 中使用的所有字符串都必须用引号("")括起来。 - 第二个参数,数字 100,是 x 坐标。这意味着文本框的左下角位于画布左边缘右侧 100 像素处。
- 第三个参数,数字 250,是 y 坐标。这意味着文本框的左下角位于画布顶部边缘下方 250 像素处。
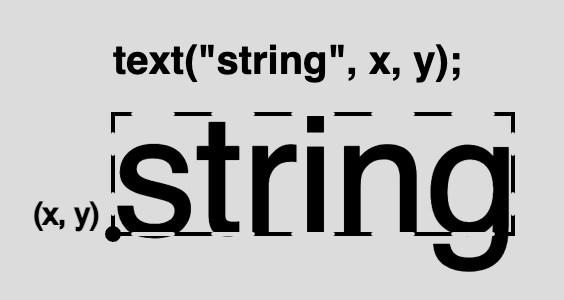
一个示意图,单词"string"位于由虚线勾勒的矩形内,左下角点标记为"(x,y)"。虚线轮廓代表包围文本的不可见框,点"(x,y)"代表描述其在 HTML <canvas> 上位置的坐标。
textSize() 使用一个数字来描述在其被调用后出现的任何 text() 函数的大小(以像素为单位)。如果你想更改画布上显示的文本大小,确保在调用 text() 函数之前使用 textSize()。
- 参见这个示例了解文本大小的差异。
绘制顺序
由于 draw() 会反复执行括号内的代码,绘制的形状会像图层一样层层叠加在画布上。前面的代码将会先绘制,而在 draw() 中靠后的代码会后绘制。因此,必须在绘制形状或文本之前,设置好 fill()、stroke() 和 textSize()。p5.js 需要在绘制形状和文本之前知道它们的颜色或大小。这也允许形状重叠,有时可以将形状隐藏在另一个形状后面!请务必检查形状的 x 和 y 坐标,看看它们是否在其他形状后面。
访问参考页面了解 text()、textSize() 和 draw() 的更多信息。
数据类型
p5.js 中的一些函数需要字符串数据类型的参数,而其他函数需要数字数据类型的参数。
例如:
circle()使用 3 个数字:一个代表其 x 坐标的数字,一个代表其 y 坐标的数字,以及一个代表其大小(像素)的数字。text()使用一个代表显示文本的字符串,以及 2 个数字:一个代表其 x 坐标的数字和一个代表其 y 坐标的数字。fill()、stroke()和background()使用数字和字符串:
步骤 9:使其具有交互性!
- 将瓢虫表情符号的 x 和 y 坐标分别换成
mouseX、mouseY。text("🐞", mouseX, mouseY);
- 在画布上移动鼠标,看看瓢虫如何跟随鼠标指针位置移动!
- 确保你点击了播放按钮或勾选了自动刷新框以更新画布。
- 添加注释来描述瓢虫如何随鼠标指针移动。
你的代码应该如下所示:
mouseX 和 mouseY 是 p5.js 库自带的内置变量——它们被称为系统变量。这些变量用于存储数值,供草图后续使用。需要跟踪会变化的数值(如 x 和 y 坐标)时,这些变量特别有用。mouseX 和 mouseY 实时记录鼠标在画布上的 x、y 坐标。任何需要传入数字的地方,都可以用 mouseX 和 mouseY代替!
查看这些示例了解如何在草图中使用 mouseX 和 mouseY:
访问 p5.js 参考页面了解 mouseX 和 mouseY 的更多信息!请务必通过访问画布坐标系和形状的 p5.js 参考页面来查看 p5.js 坐标系统。探索 p5.js 参考 中包含的其他系统变量:
错误
在编写代码时,很容易拼错函数名或忘记逗号。语法规则帮助计算机解释代码。当”规则”被打破时,错误消息将出现在控制台中(例如,如果 circle() 拼写错误)。这些错误通常称为”bug”。控制台会显示编辑器发出的消息,详细说明代码中的错误。当你的代码没有正确执行时,你的代码中可能存在 bug!访问调试现场指南了解常见错误示例以及如何修复它们。
有关更多信息,请观看 The Coding Train 的这个视频。
下一步
上一步
资源
- 视频:The Coding Train 1.2:教程
- 视频:The Coding Train 1.3:形状与绘制
- 视频:The Coding Train 1.4:颜色
- 视频:The Coding Train 1.5:错误与控制台
- 视频:The Coding Train 1.6:代码注释
- 视频:The Coding Train 2.1:p5.js 中的变量(mouseX 和 mouseY)
- p5.js 参考
- HTML 颜色名称
- HEX 颜色值