
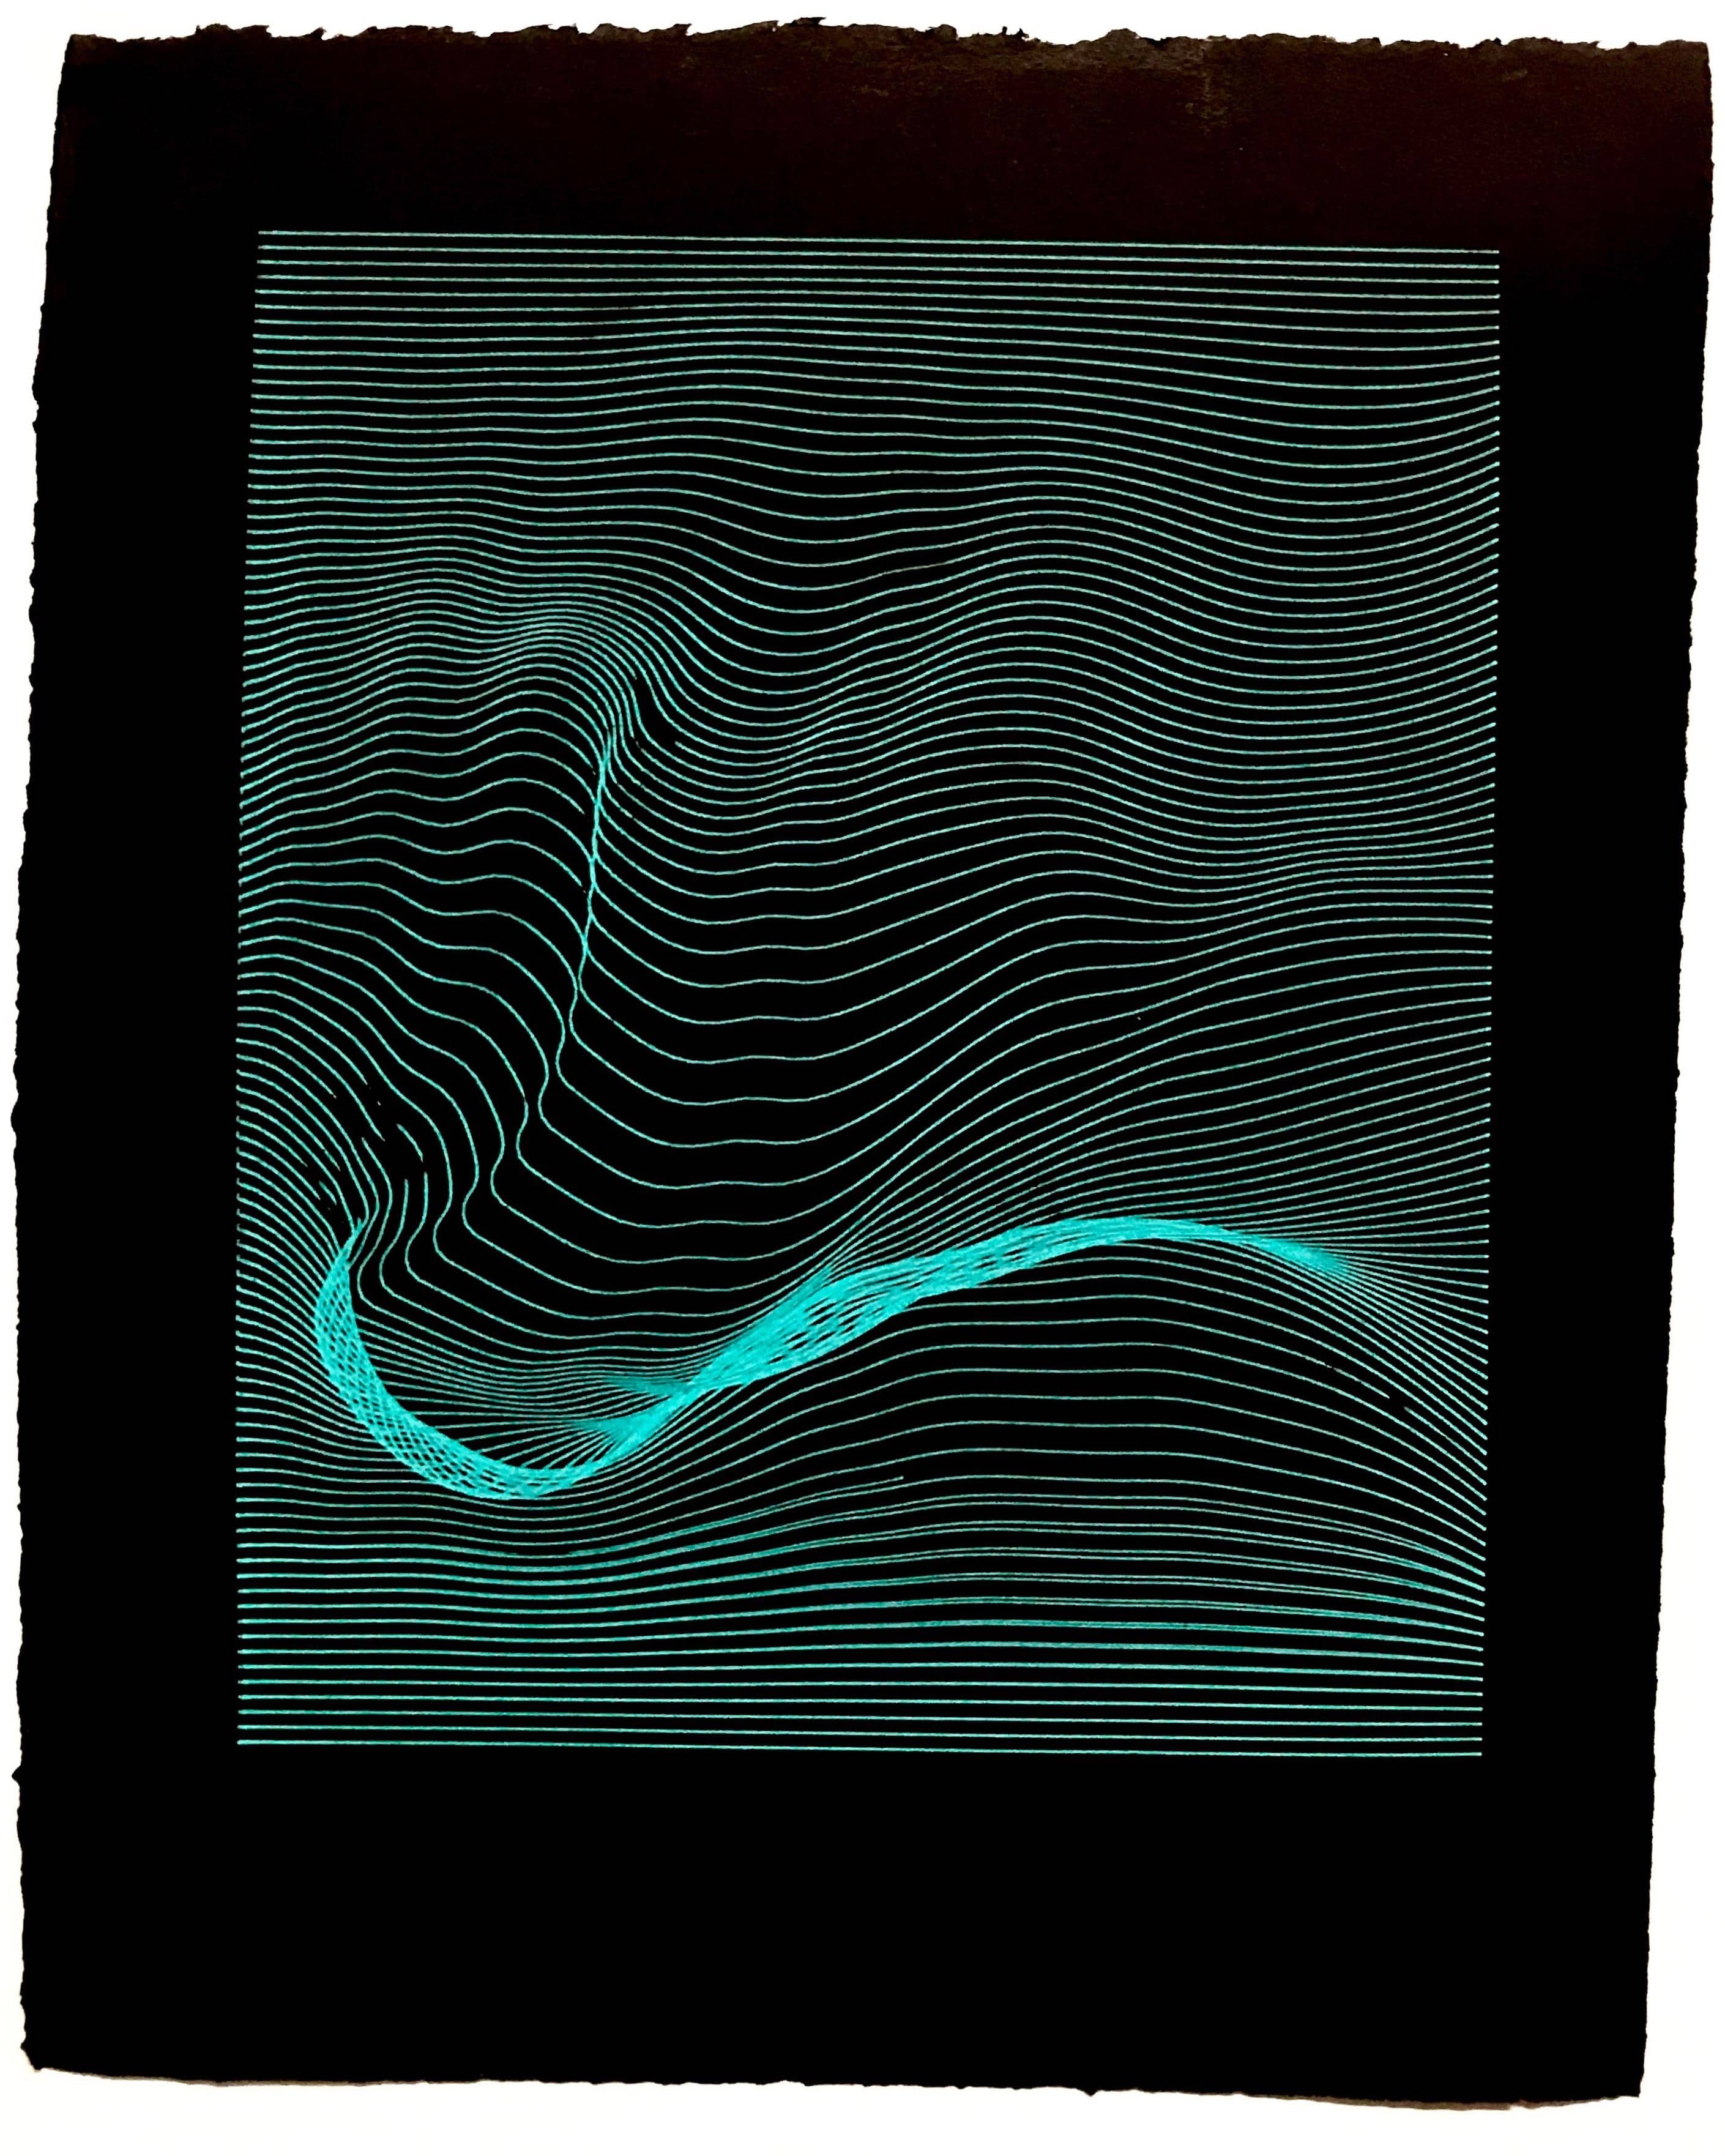
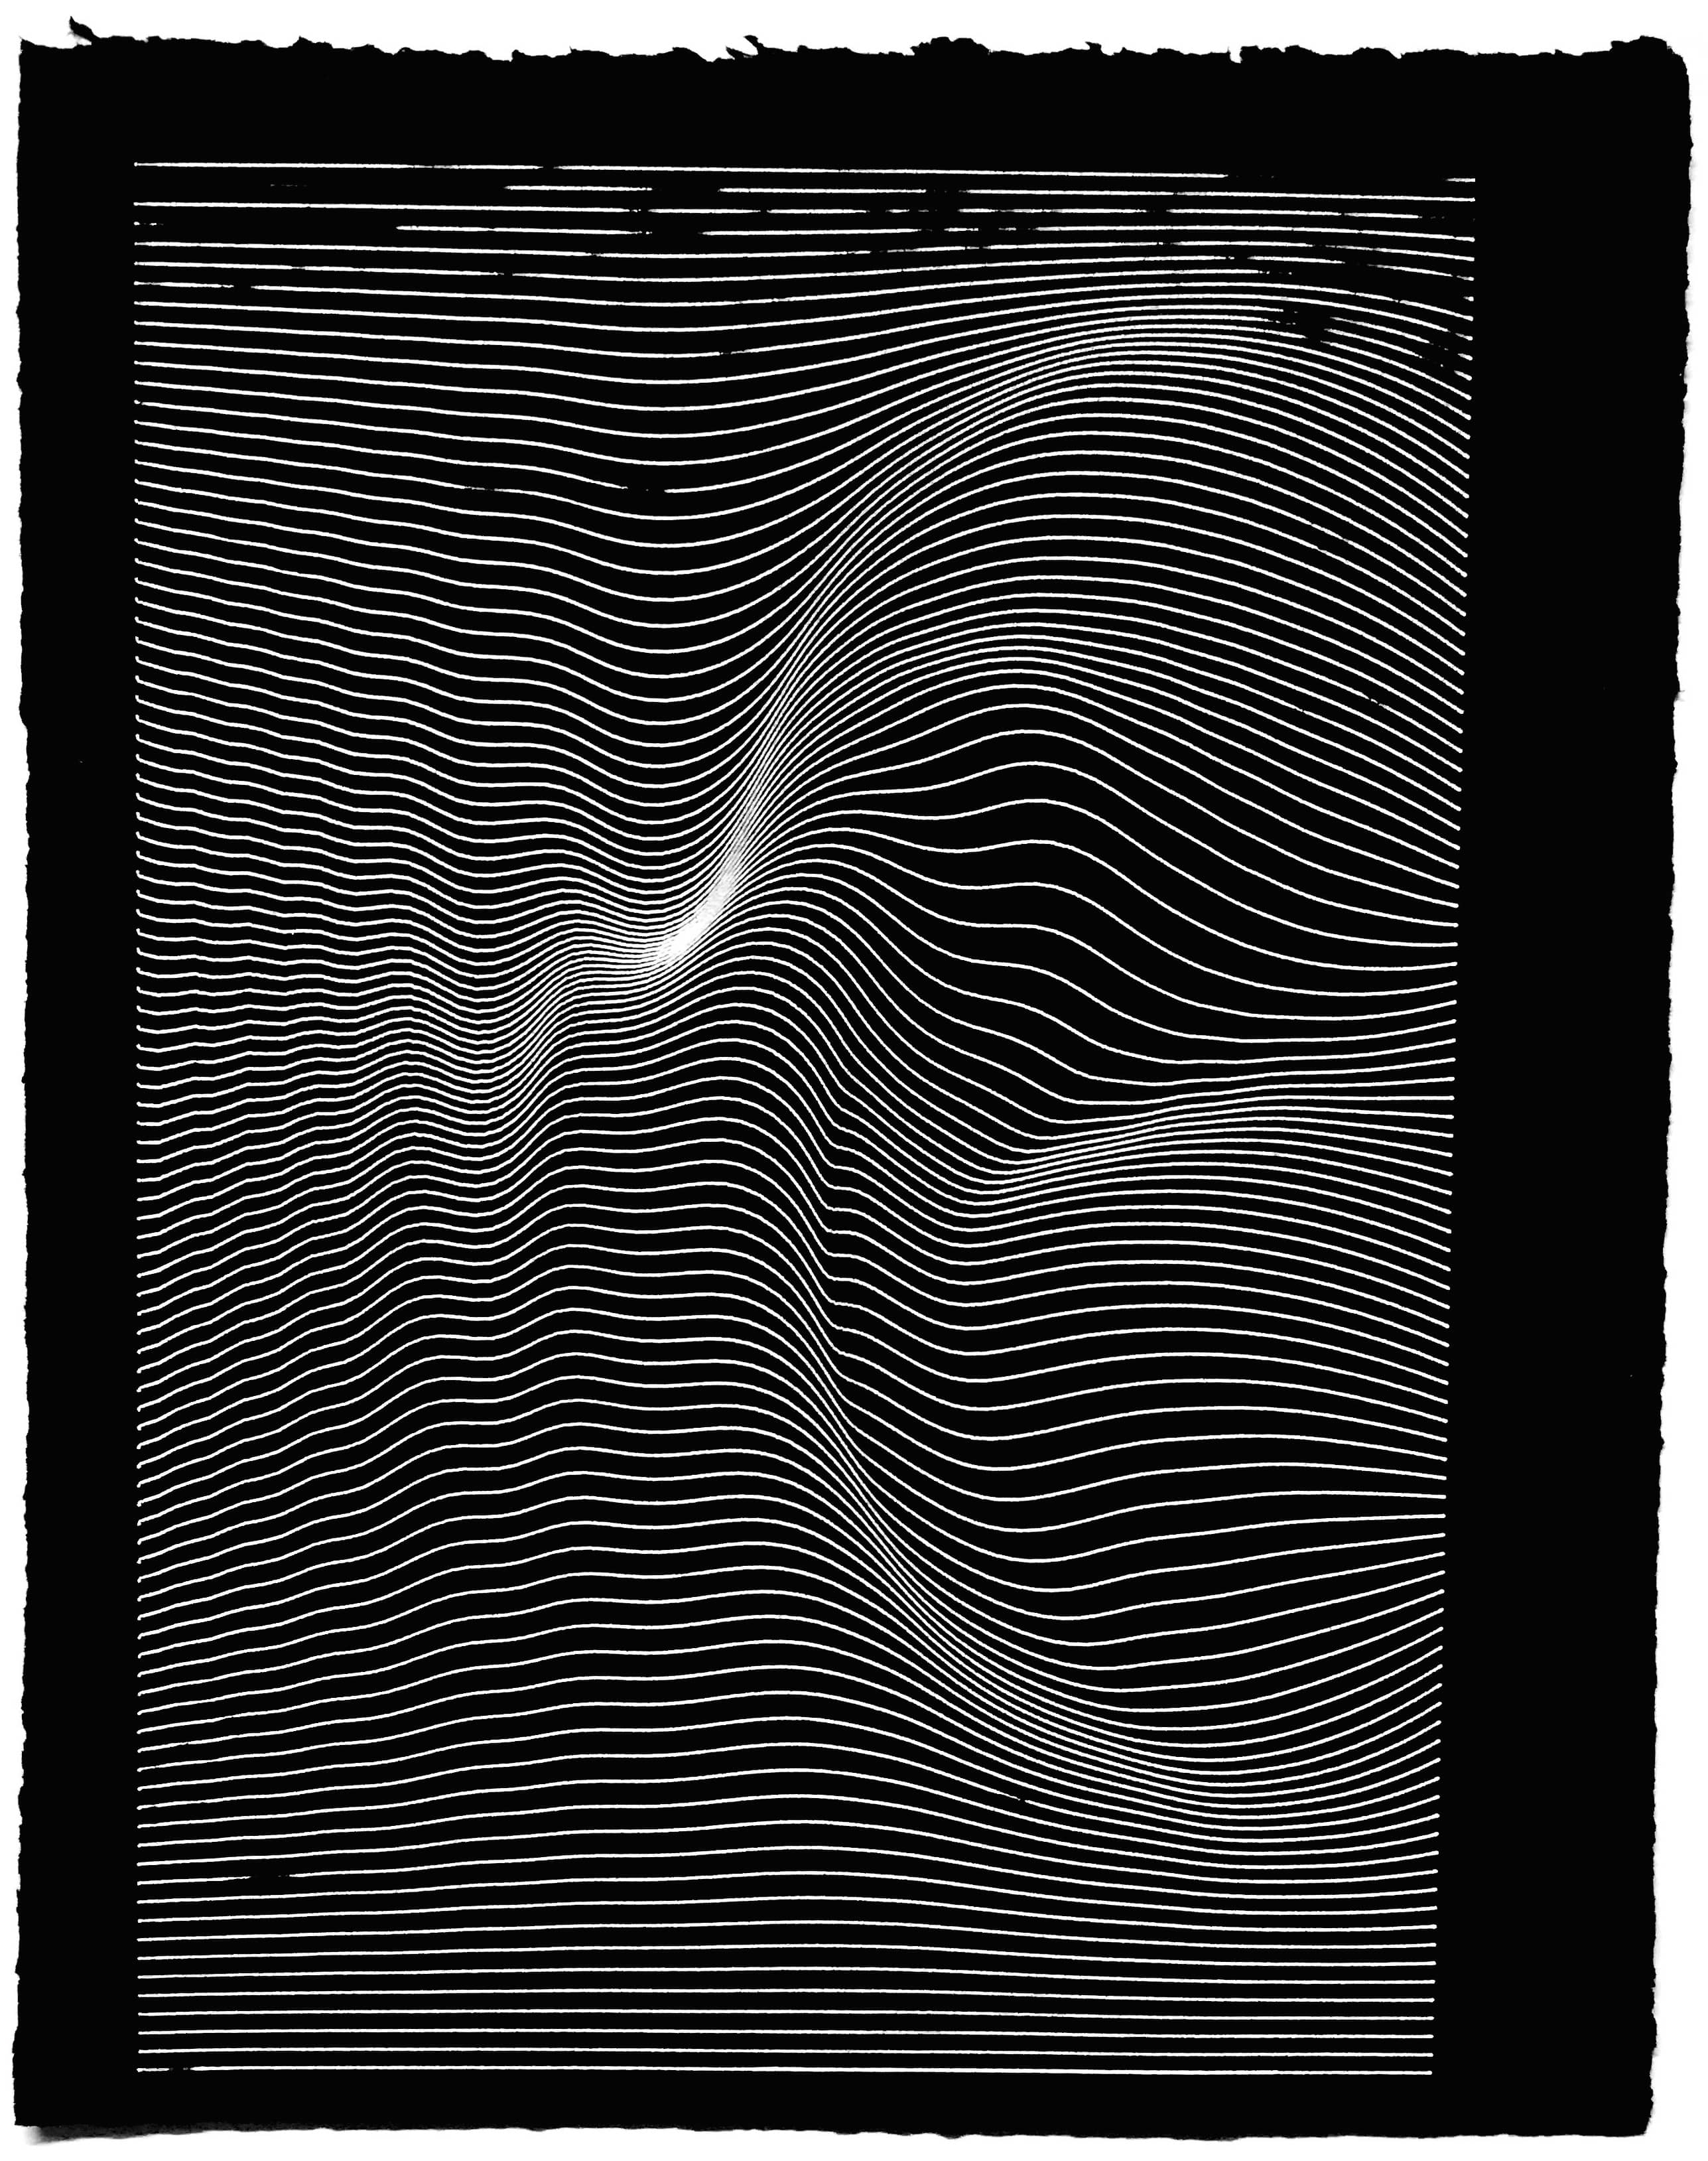
Programmed Plotter Drawings
Project Info
Q&A
What are you up to?
I just graduated from Ryerson University's New Media program. Coming from 4 years of coding and making robots, I decided to take a break and play with some more traditional forms of art—while still coding and playing with robots.
How did you get started with p5.js?
I first started using p5.js at NYU ITP Camp! After using Processing for many years, I wanted to try something new.
How did you use p5.js in this project?
I used p5.js in this project to generate the sine wave and lerp (linear interpolation) formulas and display the visuals in thep5.js Web Editor. I then used a feature in my code that exported my programmed graphic into anSVG file. I needed an SVG file to give to the plotter—an AxiDraw V3—so that it understood where to draw the lines that I programmed. I sent this information to the plotter with a program calledInkscape!
What's your favorite p5.js feature?
lerp() because lines are fun and "lerp" is a fun word to say!
Did you face any challenges working on this project? If so, how did you overcome them?
It was my first time using p5.js, Inkscape, and a plotter! I really benefited from the people around me who had used p5 before, as well as online guides and forums.
What's a cool thing we should check out?
@gandyworks on Instagram—super cool analog plotter stuff.
Where can people learn more about you?
ronicantor.com
@roni.cantor (Instagram)