As you advance in your programming abilities, you will create more complex p5.js sketches. Sometimes these sketches may run too slowly, changing the effect you were hoping to achieve. This is usually because the computer processor is not able to accomplish all the steps of your program within the default frame rate. In other words, the computer is struggling to finish the instructions at a visually pleasing speed. This guide will present a framework for code improvements that include the following steps:
- Define the Problem
- Understand and Organize Your Code
- Form a Hypothesis
- Test Your Hypothesis
- Reflect on Your Project Goals
- Iterate
This framework is useful for all code improvement and is a standard approach in computer programming. Specific emphasis will be given to code performance in the examples presented, using an example from the blog Computing Stories: Scintillating Simulations to illustrate the framework. At the end of this article, additional strategies will be provided to help you improve the performance of your code.
Prerequisites
- This guide assumes you’re comfortable programming with loops, objects, and arrays. Check out the Introduction to p5.js tutorials to brush up on these topics.
Step 1 – Define the problem
For a blog post I was writing, I wanted to create a simulation of 1,000 particles bouncing around the canvas. I went to the trouble of programming accurate laws of physics that determine the motion of each particle. As I ran the sketch with an increasing number of particles, the particles moved frustratingly slowly.
The problem is that the animation runs too slowly. I wanted to speed up the simulation to improve the visual experience for the viewer. This guide is designed to help you address any situation where you want your code to run more quickly. We will use my example to illustrate the steps involved. If you like, you can view the final blog post: Scintillating Simulations.
Step 2 – Understand and organize your code
After you have defined the problem, take a step back and reflect on your program.
- As a first step, you will need to understand what each part of your code does. I often reorganize my code as I go through this process. Improving your code in this way is called refactoring.
- Adding comments is also a great idea, as they can help remind you of your thinking. Comments can be short for small clarifications or long for explaining bigger ideas.
- In this step, I moved the
Particleclass definition into a separate file namedparticle.js. Here is an overview of the class methods that I developed.
    class Particle {
  constructor(pos, v, r, h, s) {
    // Code that creates and initializes object.
  }

  collide(p) {
    // Code that handles a single collision with another
    // particle p using a collision algorithm based on
    // Newtonian Mechanics.
  }

  bounce() {
    // Code that handles reflection off walls.
  }

  update() {
    // Code that uses velocity and gravity to update position.
  }

  show() {
    // Code that renders Particle object on the canvas.
  }
}
It is important to deeply understand the specific problem that occurred. In this case, we know that the animation is running slowly because the frame rate is lower than expected. The frame rate is the number of frames the animation gets displayed every second. Each frame is one iteration of your draw() function.
If you don’t specify the frame rate in p5.js, by default, it attempts to reach a frame rate of 60 frames per second. This creates a smooth animation based on how quickly your brain can process information through your eyes. Movement at a rate of 30 frames per second or higher will appear continuous. As the amount of time it takes draw() to run increases, if there is no longer enough time for it to run the desired number of times per second, you will see the frame rate lower. This is what made my animation look so different from what I wanted. To better understand what is going on, you may want to refer to the frameRate() documentation.
Below, I show the animation with the frame rate displayed. Displaying it will make it easier to see the impact of changes we make.
In this case, I am trying to improve the performance of my code. The same type of process would apply to improving other aspects of your code’s functionality.
Step 3 – Form a hypothesis
After spending some time reviewing my code, I developed a hunch that the problem was in the collision detection algorithm. To detect collisions, I had to compare every pair of particles to determine how close they were to each other. The first particle would be compared with the other 999 particles. Then the second particle would be compared with the other 998 particles, and so on. With 1,000 particles, there are about 1,000 x 1,000 = 1,0002 = 1,000,000 comparisons.
Estimating how many times a loop runs is a good way to determine how long it will take for your code to run. Sometimes programmers use big O notation, which describes the complexity of an algorithm. You could say that my collision algorithm has a time complexity of O(n2) because the number of comparisons required is the square of the number of particles n. With 1,000, there are about 1,0002 comparisons. Here is my collisions() function that did all this work:
    function collisions() {
  // For each pair of particles, determine if they have collided.
  for (let i = 0; i < particles.length - 1; i += 1) {
    for (let j = i + 1; j < particles.length; j += 1) {
      // declares local variables b1 and b2 to stored compared particles
      // in order to simplify expressions below.
      let b1 = particles[i];
      let b2 = particles[j];

      // Copy the current position and velocity
      // vectors of each particle.
      let pos1 = b1.pos.copy();
      let pos2 = b2.pos.copy();
      let vel1 = b1.vel.copy();
      let vel2 = b2.vel.copy();

      // Calculate the next position using Euler’s method.
      pos1.add(vel1.mult(dt));
      pos2.add(vel2.mult(dt));

      // Check for a collision.
      if (pos1.dist(pos2) < b1.r + b2.r) {
        b1.collide(b2);
      }
    }
  }
}
Usually, the operation that runs the most times is the culprit for slowing down the program. It is also possible that another part of the code is contributing to the slowdown as well. Updating the position of 1,000 particles and rendering them takes time. It also might be problematic that I am using the p5.Vector.copy() method when calculating new particle positions. There may be some calls to p5.Vector.copy() in the Particle.collide() method as well. Making copies of objects requires allocating new memory for vectors each time the loop runs; this takes time. It might be possible to save time by modifying existing vectors instead of making brand new copies.
It’s important to understand as much as you can about what your code is doing, step by step, and then develop an idea for how to address it. If you are not sure what is happening in a piece of code, a great strategy is to include a console.log() or print() to print out the value of a variable to the console.
Step 4 – Test your hypothesis
The simplest way to test your ideas is to make changes and then see what happens. It is usually best to make one change at a time and test between each change. Be careful and deliberate in your testing. Use the process to better understand your code.
While testing my code, I thought to myself, “Do I need to have 1,000 particles?” I tried the sketch with 500 particles instead.
    let numParticles = 500;
// Rest of sketch.
Look at the difference it makes! I included the frame rate in the visualization using the frameRate() function. I display it on the canvas, but an alternative is to simply print it out to the console using console.log(frameRate()).
Before
After
The sketch runs smoothly with fewer particles, so that change seems to solve the problem. It is probably the easiest solution available.
Similarly, I wondered if I needed to simulate the actual laws of physics. In this case, that was important to the project, but for a game, a simplified version of the physics could still work well and greatly improve performance.
I could also try to use memory more effectively by modifying the original p5.Vector objects and avoiding calls to p5.Vector.copy(). This kind of change requires care. When you update an object that is used elsewhere in your code, you might cause an inadvertent bug.
A great strategy is to make a change and see how it improves performance using frameRate() as a benchmarking tool. If the frame rate drops, you know you have a problem. This also allows you to ensure you have not inadvertently introduced a new bug into the code.
As you become more sophisticated in your testing, you may want other ways to evaluate what is happening quantitatively. With Chrome, you can open up the developer tools and turn on the “Show FPS meter” option to get a graph of FPS (frames per second, the unit frameRate() measures).
You might also want to check how much time a function or subroutine takes to run. A quick way to do this is called manual profiling. Using the millis() function, you can check the time before and after a block of code. For example:
    let start = millis(); // store the time before the code block.
// Do the stuff that you want to time
random(0, 100);

// store the time after the code block
let end = millis();
let elapsed = end - start;
console.log(`This took: ${elapsed} ms.`) // print the difference or time elapsed.
It is best to run the code you are trying to profile multiple times and then compute the average.console.log() and print() will slow down your code, so be sure to remove them from the final version of your project!
If you are feeling confident with these steps, you might want to try automated profiling. The developer tools in Chrome have a performance evaluation feature so you can automatically get a snapshot of performance in your code.
Begin by opening Chrome DevTools and navigating to the “Performance” tab. Initiate recording by clicking the circular button or using the shortcut (Ctrl+E/Cmd+E), and then perform interactions on your web page to simulate user actions. Click the Stop button in the profiler after it has collected a few seconds of data.
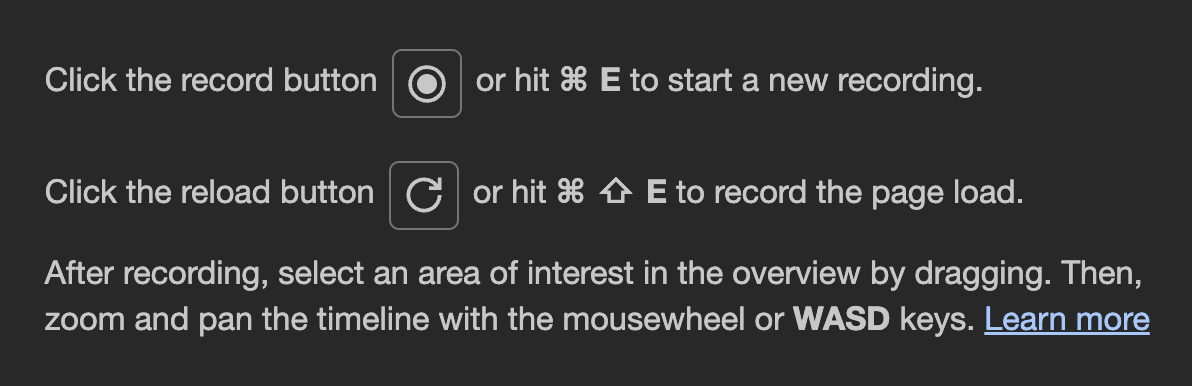
A screenshot of the profiler in the Chrome developer tools before recording. It says, "Click the record button or hit Cmd+E to start a new recording. Click the reload button or hit Cmd+Shift+E to record the page load. After recording, select an area of interest in the overview by dragging. Then, zoom and pan the timeline with the mousewheel or WASD keys."
In my case, I just let the animation run after I clicked record. The profiler captures a detailed timeline of events, including CPU and memory usage. These usage figures can give you more insight into why your algorithm may be running slowly. You can view performance using the Flame chart, which visually represents the call stack and highlights functions contributing significantly to execution time. I clicked on the Bottom-Up tab to determine which functions took the most time.
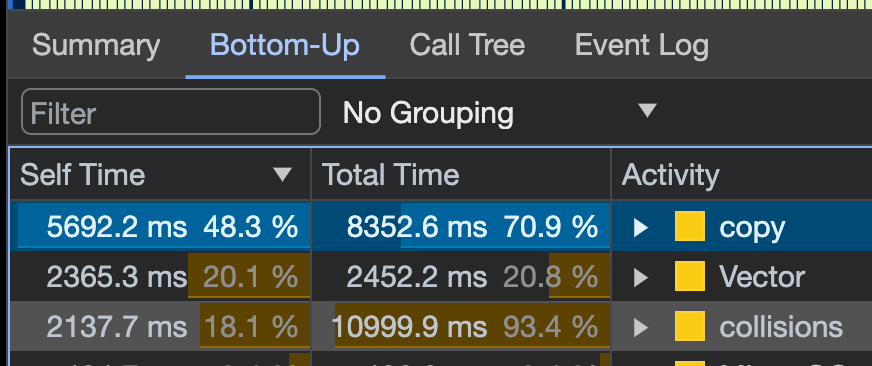
A screenshot of the Bottom-Up tab of the Chrome profiler after having recorded data, displayed in a table. The Self Time, Total Time, and Activity columns are visible, sorted by Self Time descending. The top item is the copy method, accounting for 48.3% of the time.
It looks like I was right about the collisions() function, which takes 93.4% of the time. It seems like most of that is taken up by using p5.Vector and its .copy() method in that loop. Of course, you will need to have nicely named functions for this tool to be helpful. See the performance features reference page for complete documentation.
Once you are satisfied with your level of knowledge of the different choices available to you, it is time to decide how to improve your code.
Step 5 – Reflect on your goals and decide
Optimizing your code is an ongoing process that involves trade-offs. Consider carefully what you are trying to accomplish and remember that developing code is a creative process. You can try out different ideas by making copies of your sketch and then seeing which solution best meets your needs. For my project, the best solution might be to reduce the number of particles in the simulation.
Scientists and game developers who study physics simulations, like the one we’ve been looking at, have developed an alternative strategy of dividing the canvas into smaller regions so that you only have to detect collisions between particles in the same region. That is a clever solution that would require considerable refactoring of my code and might be the subject of a future tutorial. Look up “spatial partitioning” in games to find more information online.
Make the decision that best meets the goals of your project and take advantage of learning more about coding in the process.
Step 6 – Iterate
Programming is an iterative process. Keep going through these steps to develop and expand your sketches. When I was working on my blog post, I went through the steps multiple times until I created an animation that performed well. By iterating, I could focus on one issue at a time, improving my sketch step by step. For example, I reduced the number of particles so that the animation ran smoothly and at an appropriate speed.
Additional performance improvement strategies
There are many ways to improve your sketch’s performance. Here are some helpful tips and techniques that you can try in different scenarios.
Frontload time-consuming processes
If you can, it’s best to frontload processes that take up a lot of time, such as image processing, so that they run once, rather than every frame in draw(). Do as much as you can during setup() so that draw() can be as fast as possible. Add a preload() function to ensure files are loaded into your projects before other functions begin.
Disable the Friendly Error System (FES)
When you use the non-minified p5.js file, as opposed to p5.min.js, there is a Friendly Error System (FES) that provides warnings about issues such as unexpected arguments passed to a function. The FES can significantly slow down your code, up to ~10x in some cases! You can disable the FES with one line of code at the top of your sketch:
p5.disableFriendlyErrors = true; // disables FES
Use native JavaScript
You can speed up your code by using native JavaScript methods over p5.js methods. For example, you can call Math.min(5, 4, 3) using the Math object, instead of min(5, 4, 3) from the p5.js library.
Here are some examples, recorded in Chrome, running each method 10,000,000 times:
Method | Time (ms) | |
|---|---|---|
Random | p5.js | 283.88 |
Native | 190.01 | |
Minimum | p5.js | 781.41 |
Native | 538.15 |
Image processing
When looping through the pixels in an image, you can get an easy performance boost by simply reducing the size of your image or by sampling it. If you are working with a 1,000 x 1,000 image, you are iterating through 1,000,000 pixels. If you chop that image in half to 500 x 500 (250,000 pixels), you now only need to do 1/4 of the iterations you were doing previously.
You have several options when it comes to resizing and sampling:
- Resize the image before importing by using an app such as Photoshop or GIMP. This will likely result in the best quality image because you can control the resizing algorithm and apply filters to sharpen the image.
- Resize the image using
p5.Image’sresize()method. Here, you are mostly at the whim of the browser for how it handles resizing. Check out MDN for more info on image rendering. - Sample the image by only drawing every 2nd (or 3rd or 4th, etc.) pixel from the original image. Dead simple and effective, but you can potentially lose thin details in the image if you skip a lot of pixels.
- Practically speaking, these appear to have roughly the same performance. Resizing the image beforehand gives you the most control over the final visuals. If you can’t resize, sampling or resizing in the sketch may serve you well.
- One last note! If you are doing drastic resizing of an image or you have an image with important fine details, sampling or resizing can give pretty poor results.
Next Steps
- Refactoring Code
- What is Big O Notation?
- Analyze Runtime Performance - Chrome
- Performance features reference - Chrome
- Physics Libraries
- Spatial Partition
- Optimizing p5.js WebGL Sketches